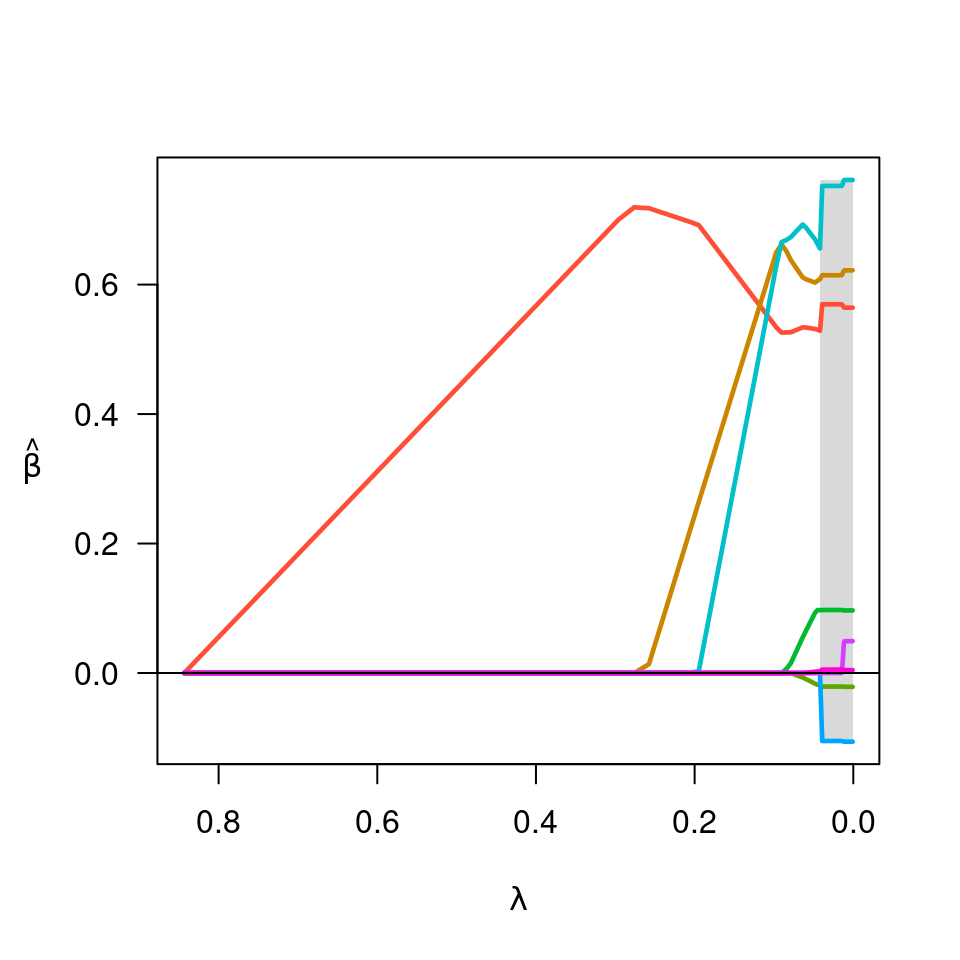
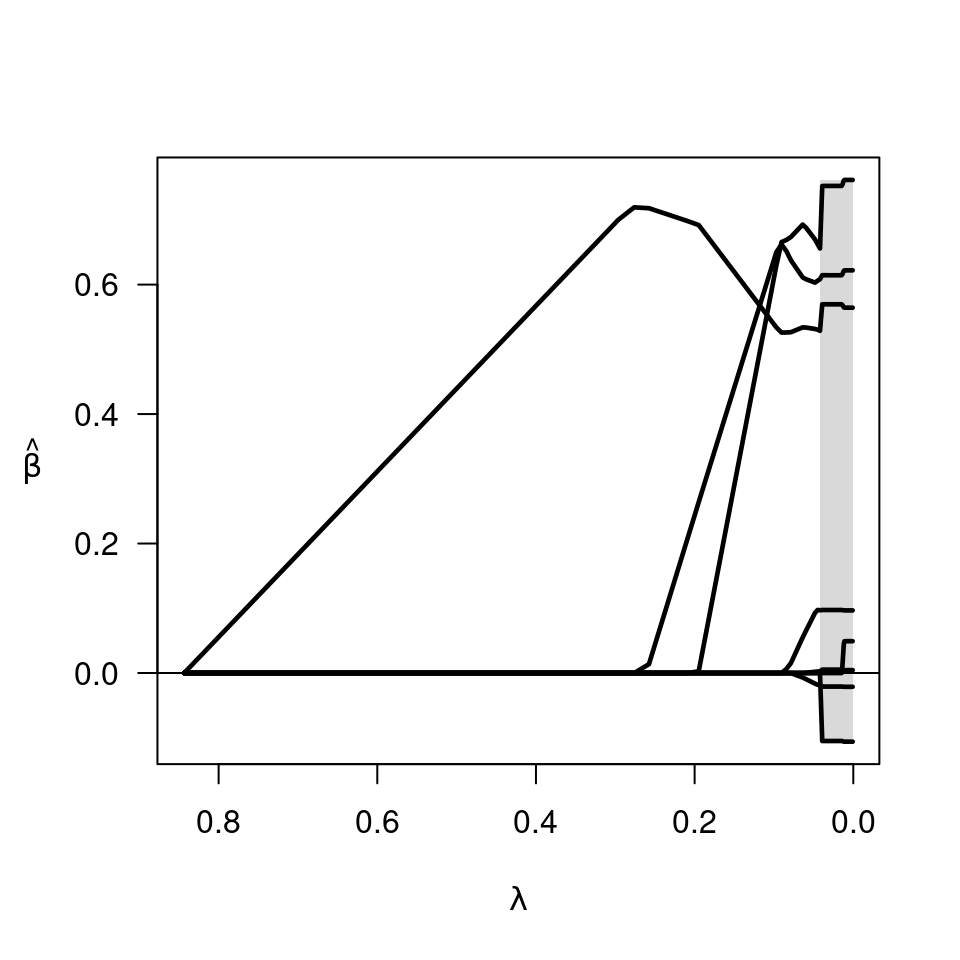
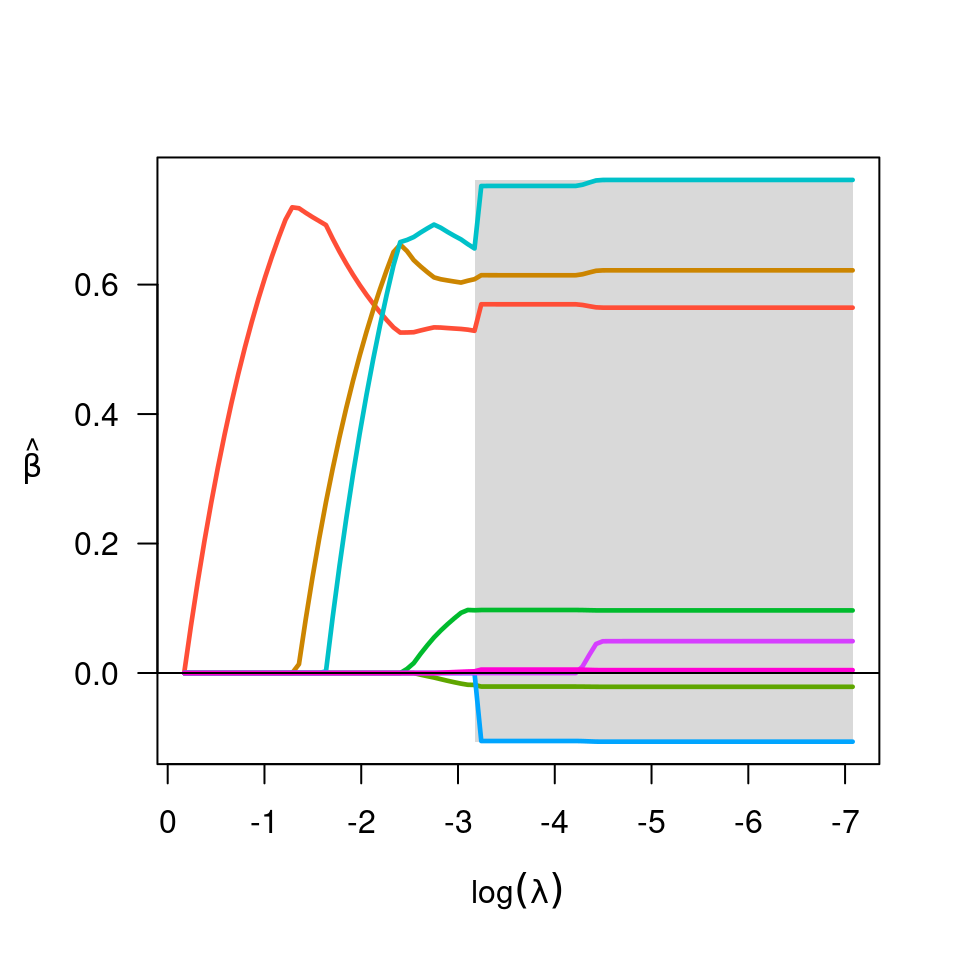
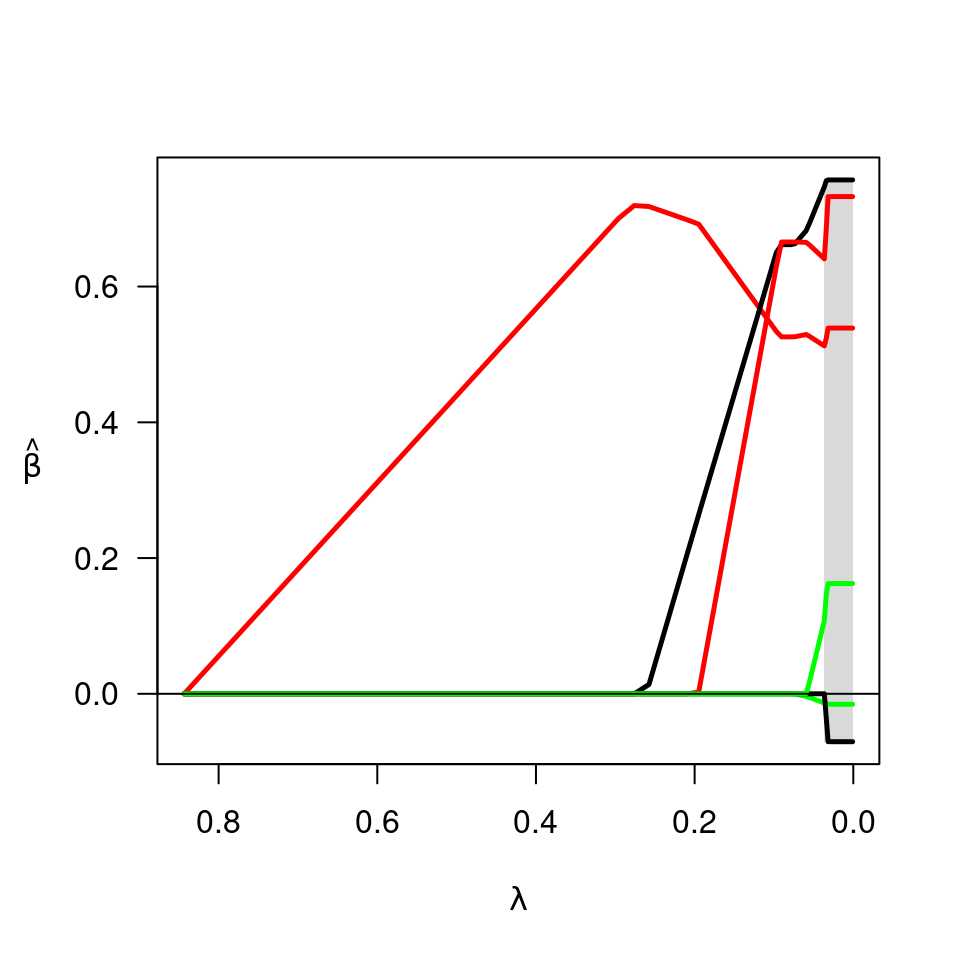
Produces a plot of the coefficient paths for a fitted ncvreg object.
Usage
# S3 method for class 'ncvreg'
plot(x, alpha = 1, log.l = FALSE, shade = TRUE, col, ...)
Arguments
- x
Fitted
"ncvreg"model.- alpha
Controls alpha-blending, helpful when the number of features is large. Default is alpha=1.
- log.l
Should horizontal axis be on the log scale? Default is FALSE.
- shade
Should nonconvex region be shaded? Default is TRUE.
- col
Vector of colors for coefficient lines. By default, evenly spaced colors are selected automatically.
- ...
Other graphical parameters to
plot()
References
Breheny P and Huang J. (2011) Coordinate descent algorithms for nonconvex penalized regression, with applications to biological feature selection. Annals of Applied Statistics, 5: 232-253. doi:10.1214/10-AOAS388