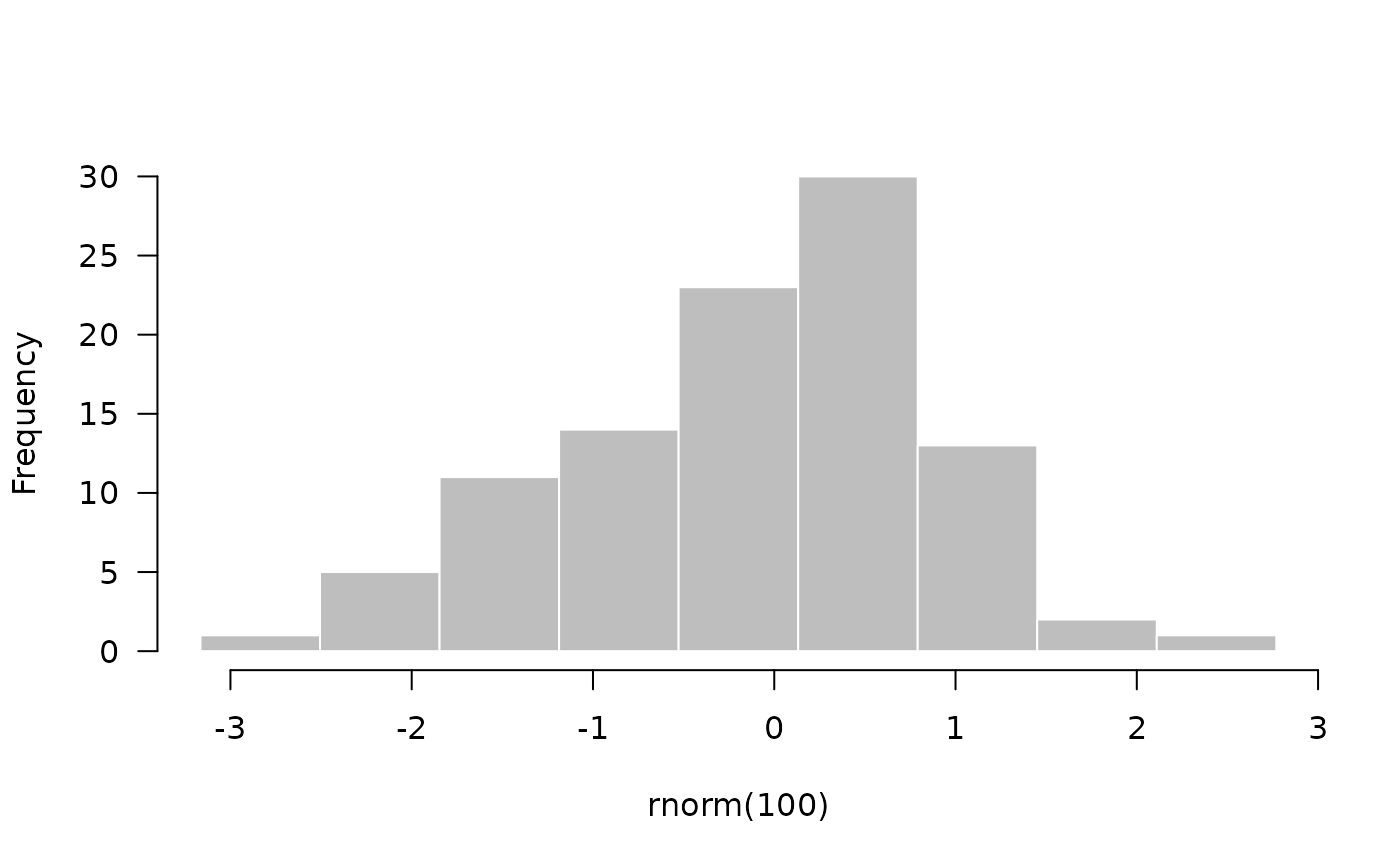
Nicer-looking histogram
Hist.RdNicer-looking histogram
Usage
Hist(
  x,
  ...,
  col = "gray",
  border = "white",
  n = 10,
  breaks = seq(min(x, na.rm = TRUE), max(x, na.rm = TRUE), len = n),
  main = "",
  las = 1,
  xlab = deparse(substitute(x))
)
Arguments
- x
A vector of values to make a histogram out of
- ...
Further arguments to
hist()- col
Fill color for histogram bars; default: gray
- border
Border (outline) of histogram bars; default: white
- n
Number of bins
- breaks
Specific locations at which bins are to be constructed; overrides
n- main
Main title; default: none
- las
See
par()- xlab
Just like in every other plot
Examples
Hist(rnorm(100))
