Customized plotting functions
Plot.RdCustomized plotting functions
Usage
Plot(obj, ...)

# S3 method for class 'BinaryTree'
Plot(obj, pval = FALSE, summary = FALSE, digits = 1, ...)

# S3 method for class 'rpart'
Plot(obj, summary = FALSE, digits = 1, ...)

# S3 method for class 'survfit'
Plot(
  obj,
  legend = c("top", "right", "none"),
  xlab = "Time",
  ylab = "Survival",
  col,
  ...
)
Arguments
- obj
Object to be plotted
- ...
Additional arguments to underlying plot function
- pval
Show p-values at branching nodes? Default=FALSE
- summary
Show summary statistics at terminal nodes? Default is FALSE; plots are drawn instead.
- digits
Number of digits to show in edges. Default: 1.
- legend
Where to put the legend. Either 'top', 'right', or 'none'; default: 'top'
- xlab, ylab
Axis labels.
- col
Vector of colors corresponding to groups.
Examples
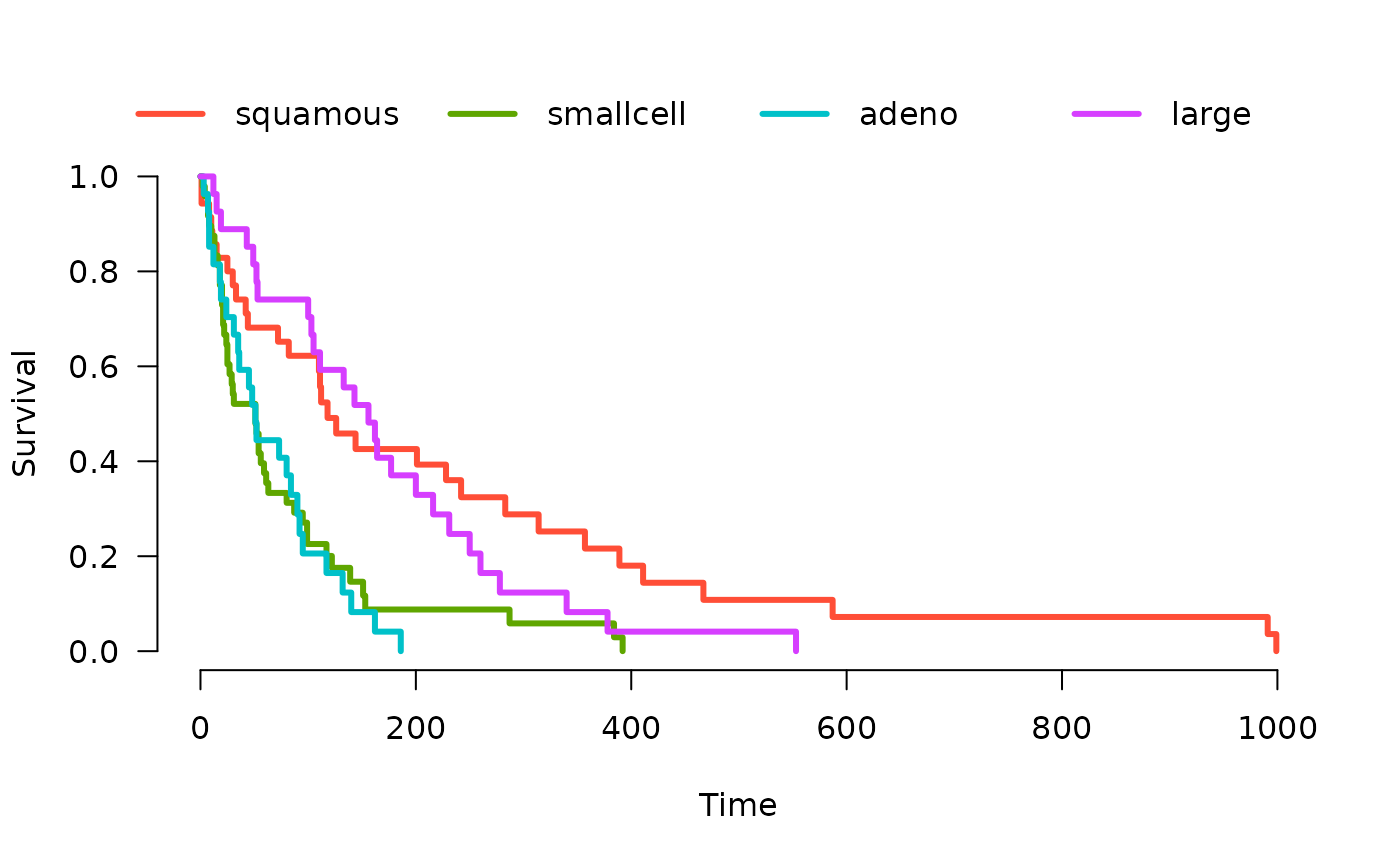
# KM curves
veteran <- survival::veteran
fit <- survival::survfit(survival::Surv(time, status) ~ celltype, veteran)
Plot(fit)
 # Trees
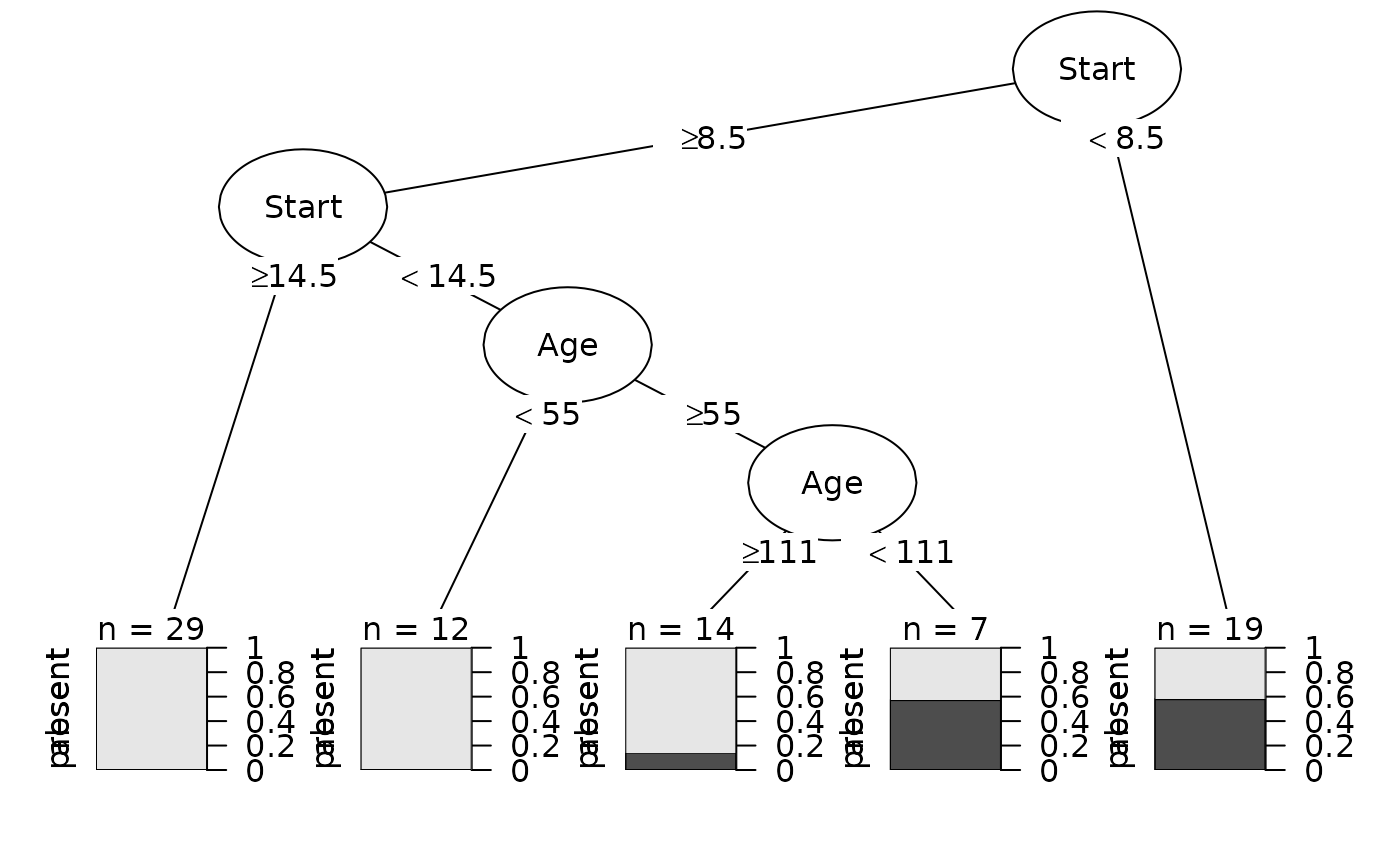
data(kyphosis, package='rpart')
fit <- rpart::rpart(Kyphosis ~ Age + Number + Start, data = kyphosis)
Plot(fit)
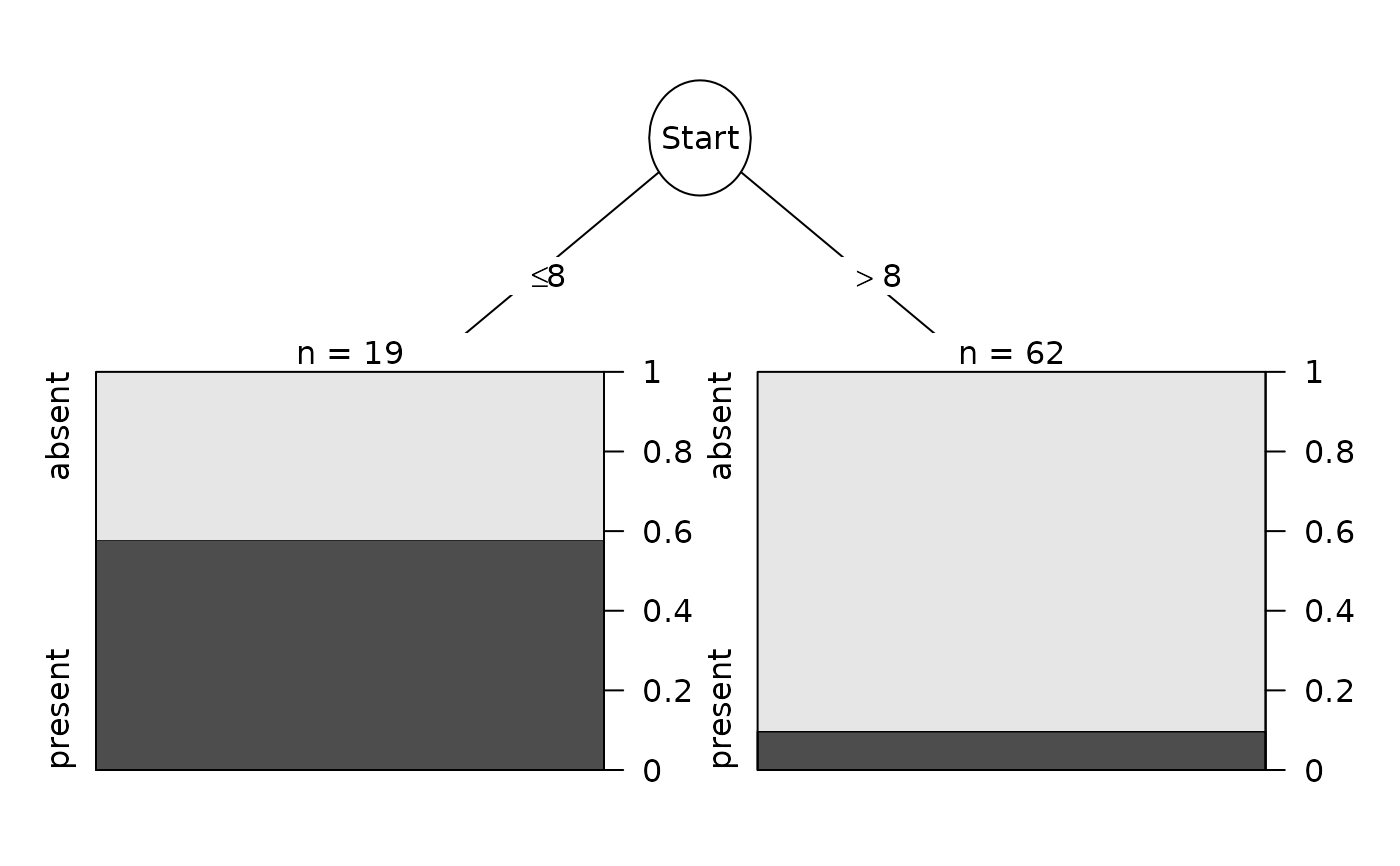
 fit <- party::ctree(Kyphosis ~ Age + Number + Start, data = kyphosis)
Plot(fit)
 Plot(fit, summary=TRUE)
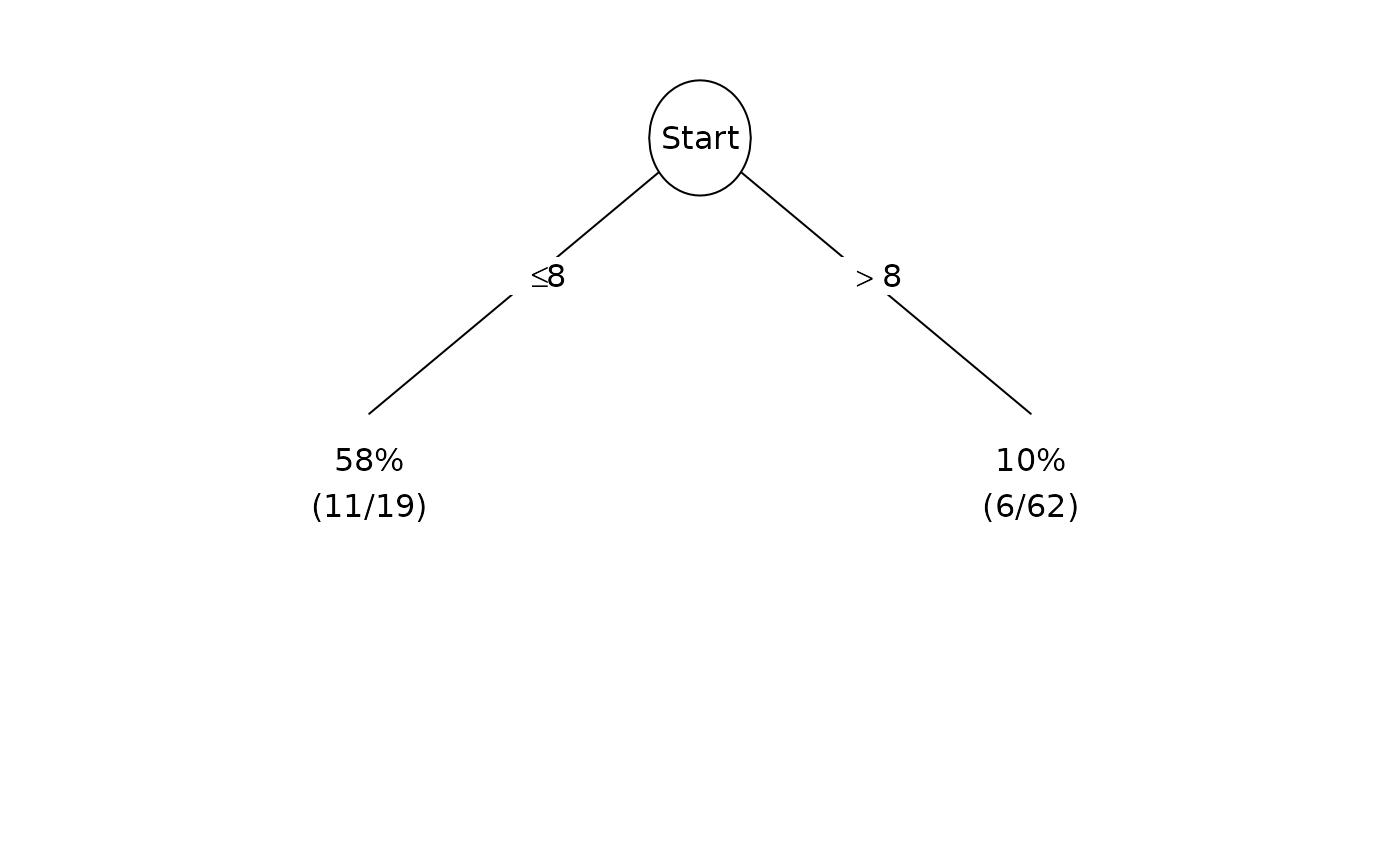 Plot(fit, summary=TRUE, pval=TRUE)
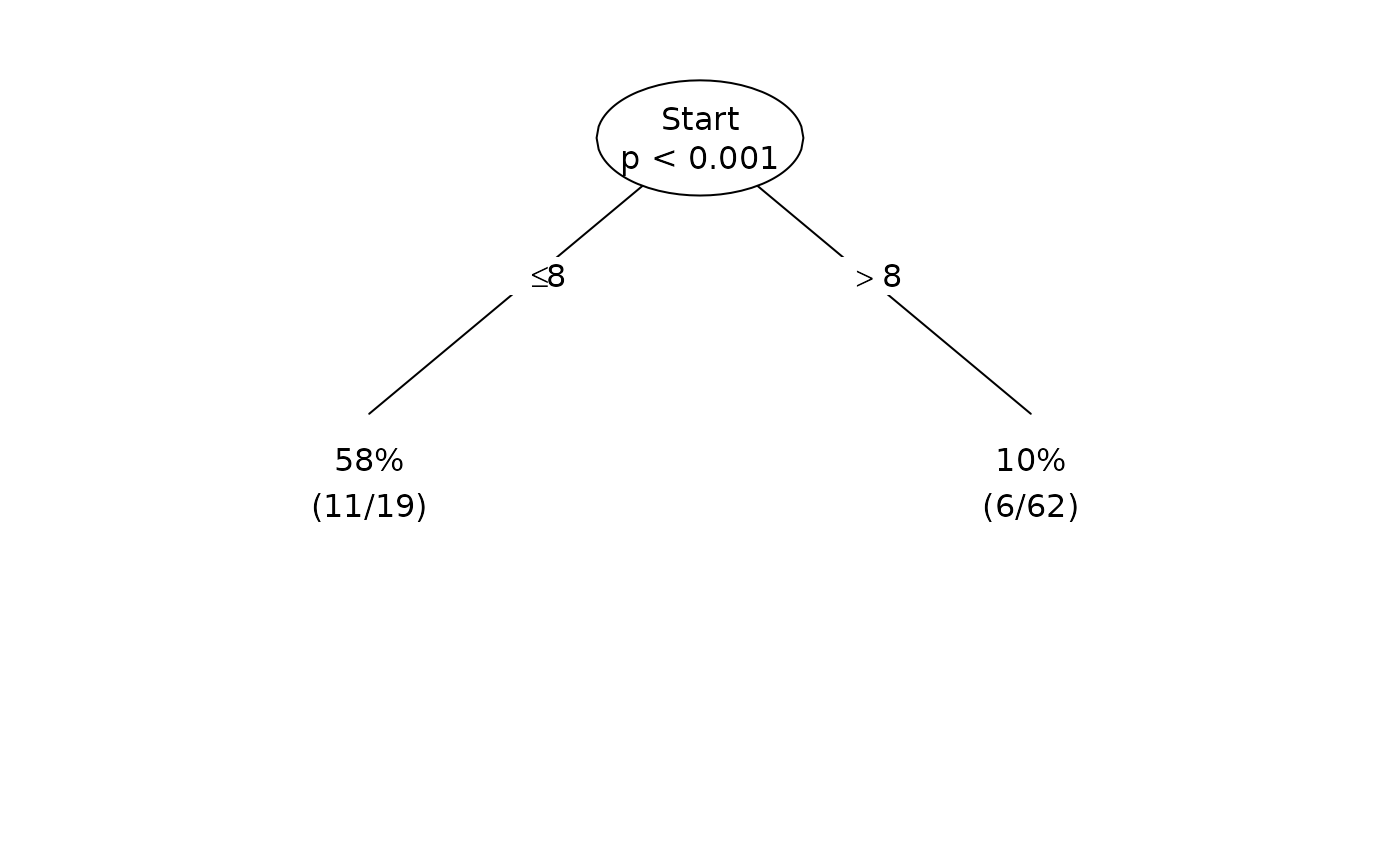 Plot(fit, pval=TRUE, digits=2)
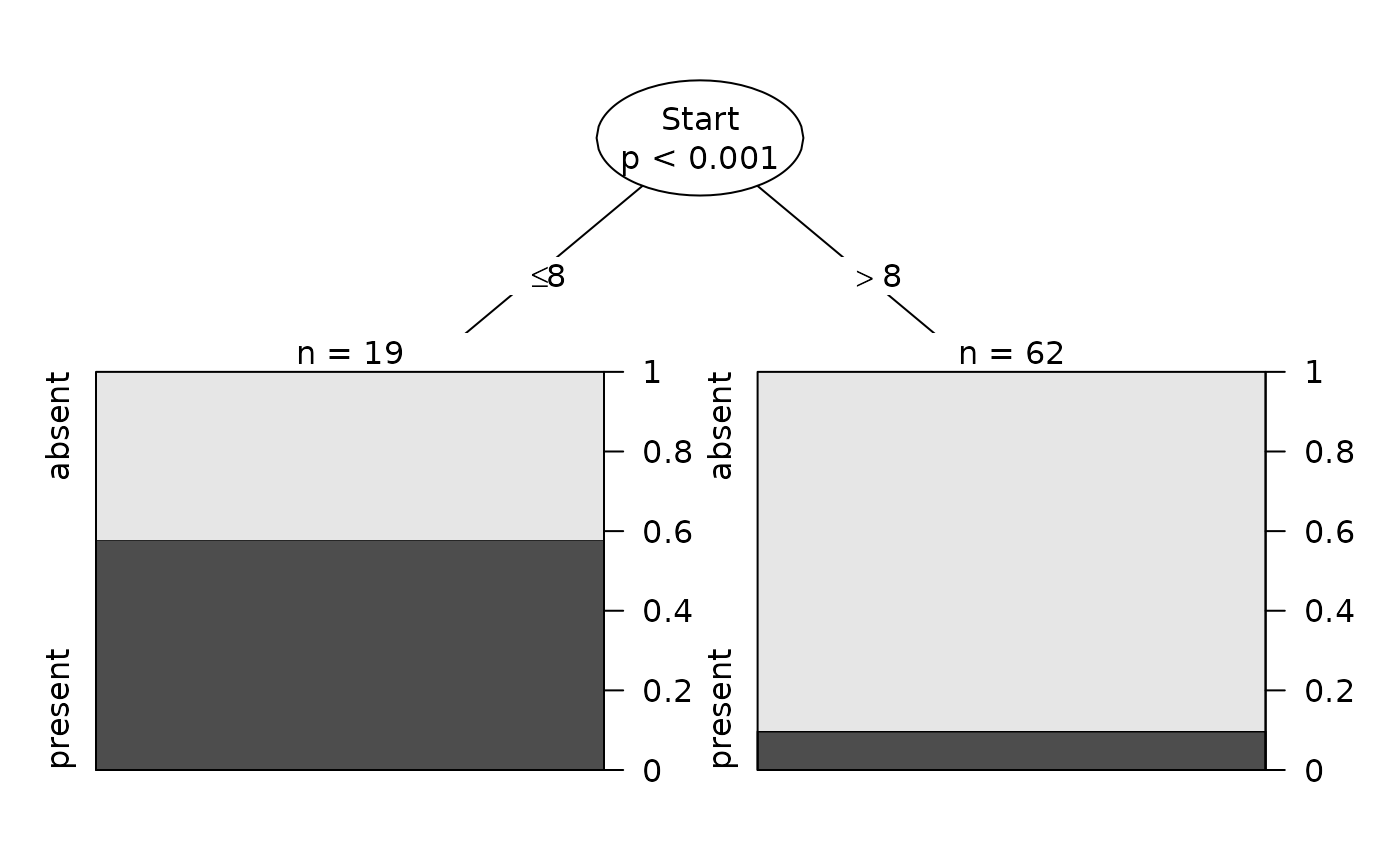 Data <- kyphosis
Data$Start <- Data$Start + runif(nrow(Data))
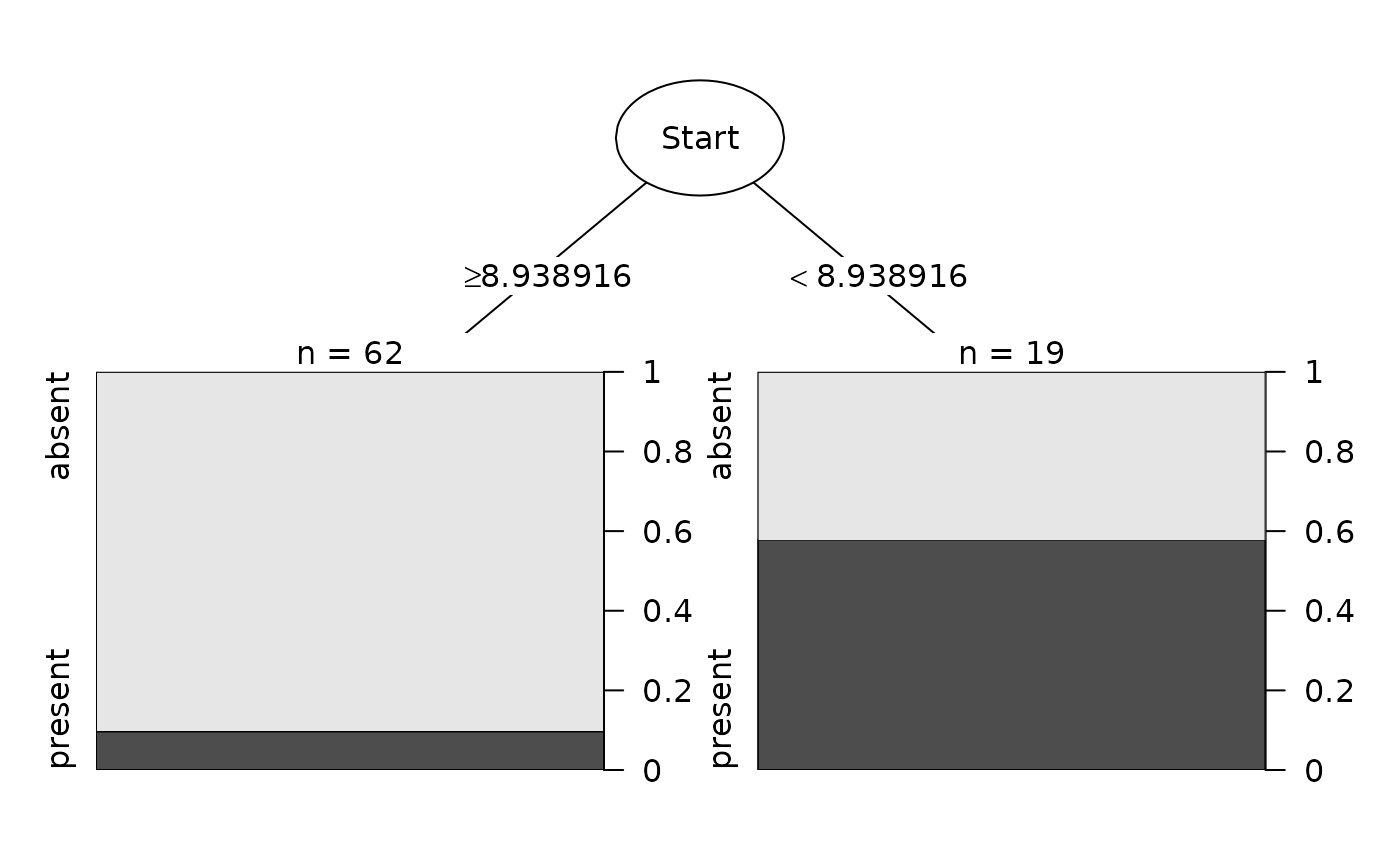
fit <- rpart::rpart(Kyphosis ~ Age + Number + Start, data = Data)
Plot(fit)
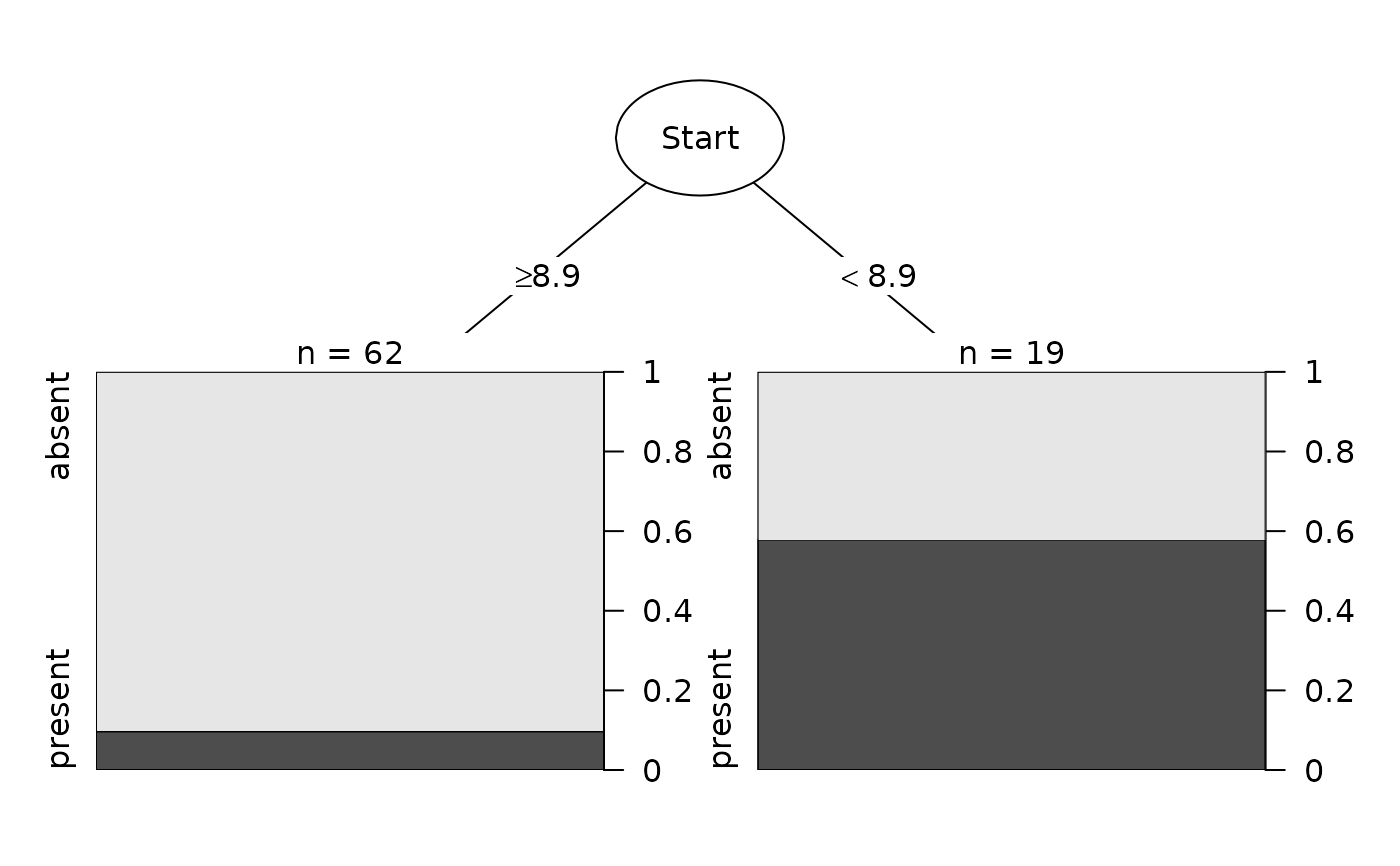 Plot(fit, digits=10)
