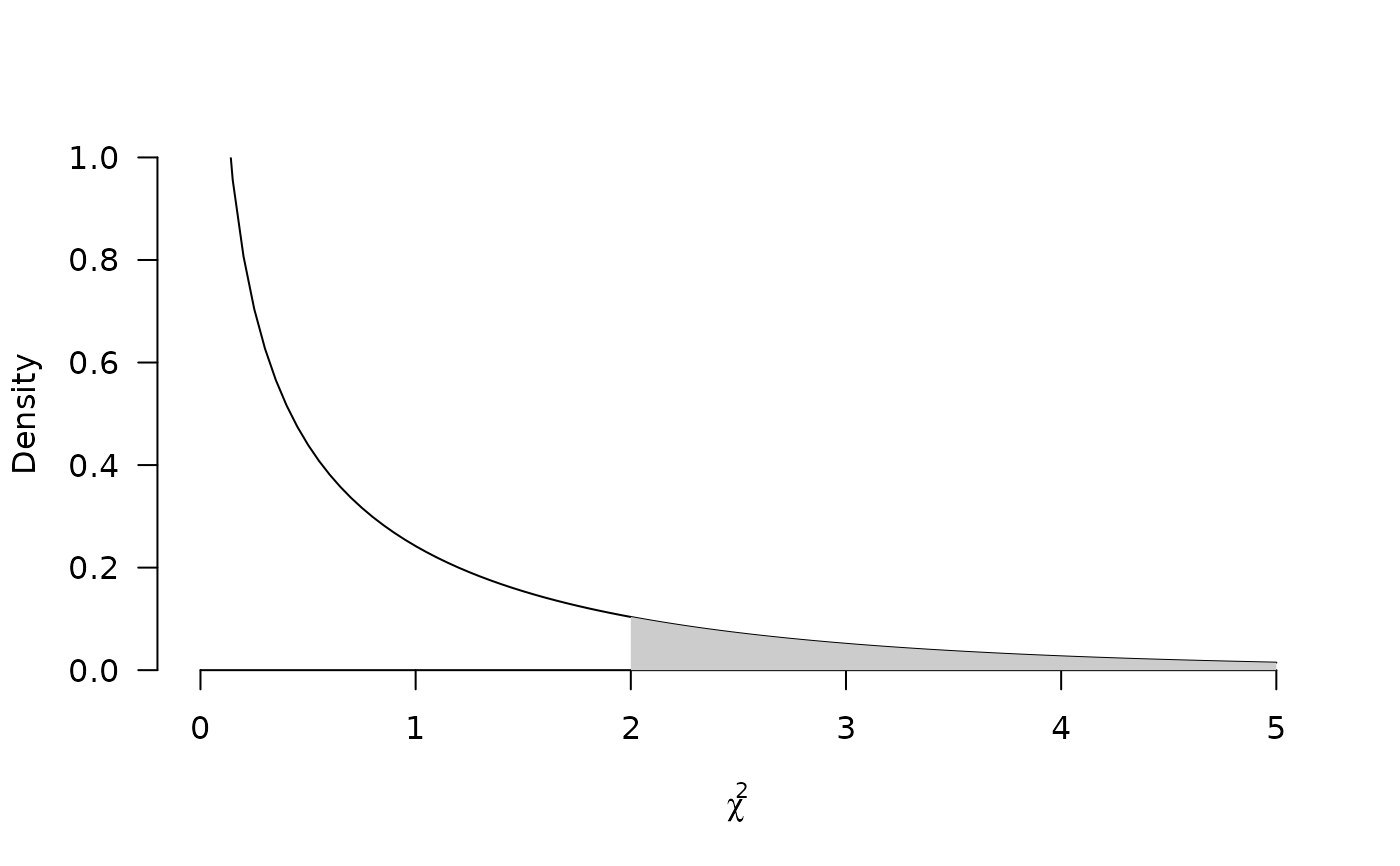
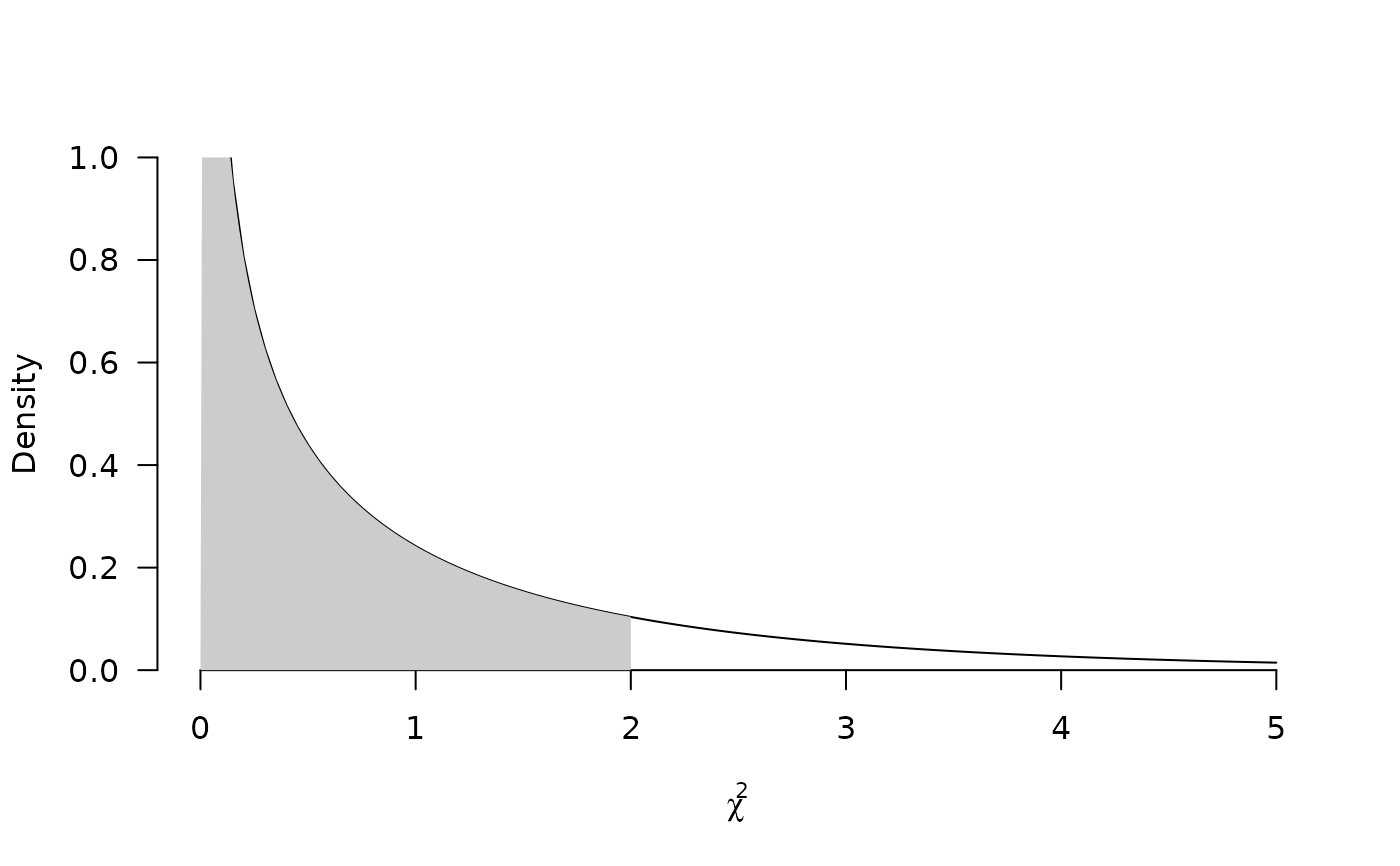
Draw a chi-squared curve and shade area to the right (probability)
chisqProb.RdDraw a chi-squared curve and shade area to the right (probability)
Arguments
- a
Point in question
- right
Shade the area to the right? Default is TRUE; otherwise area to the left is shaded
- df
Degrees of freedom; default: 1
- ...
Additional arguments to
plot()

