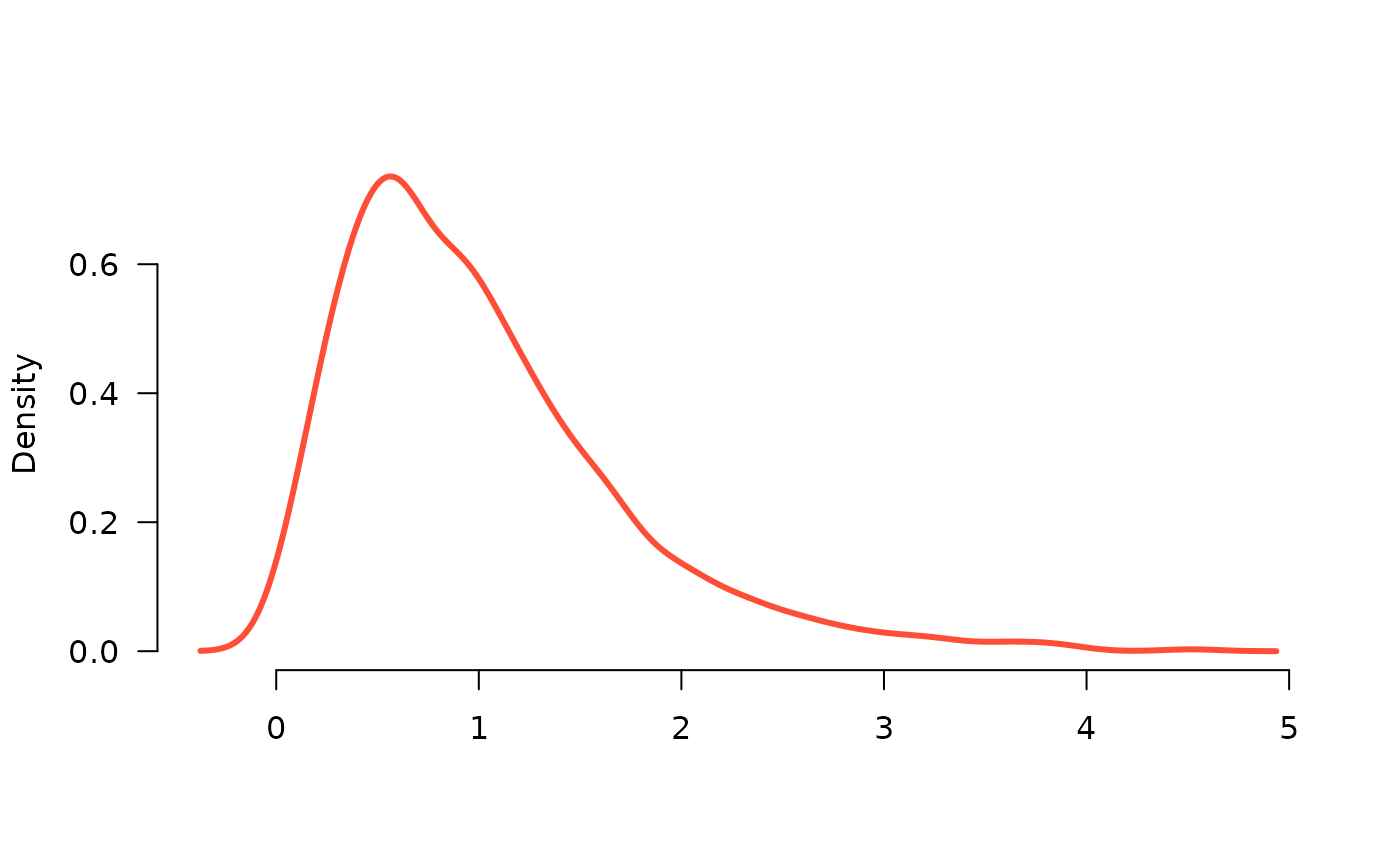
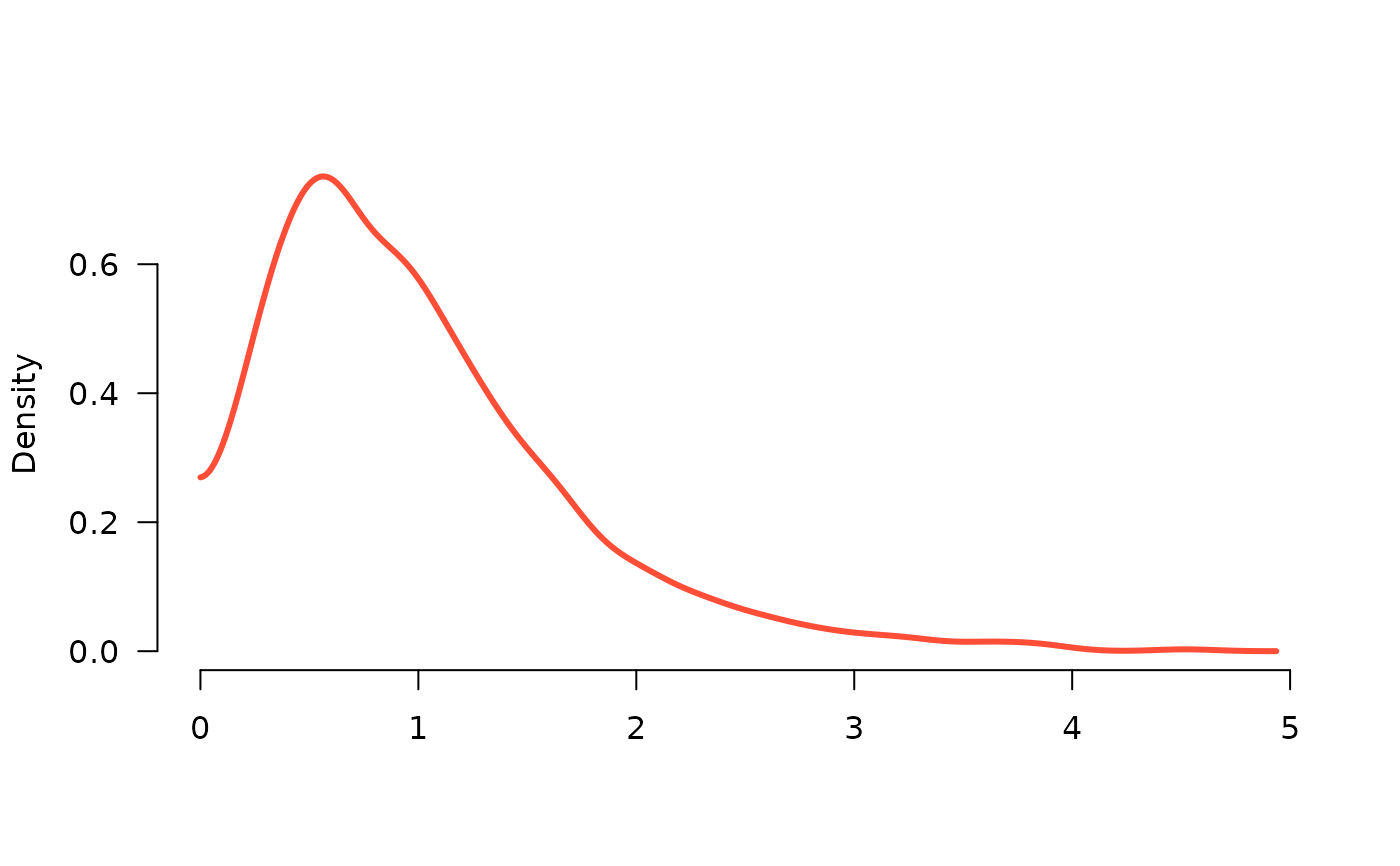
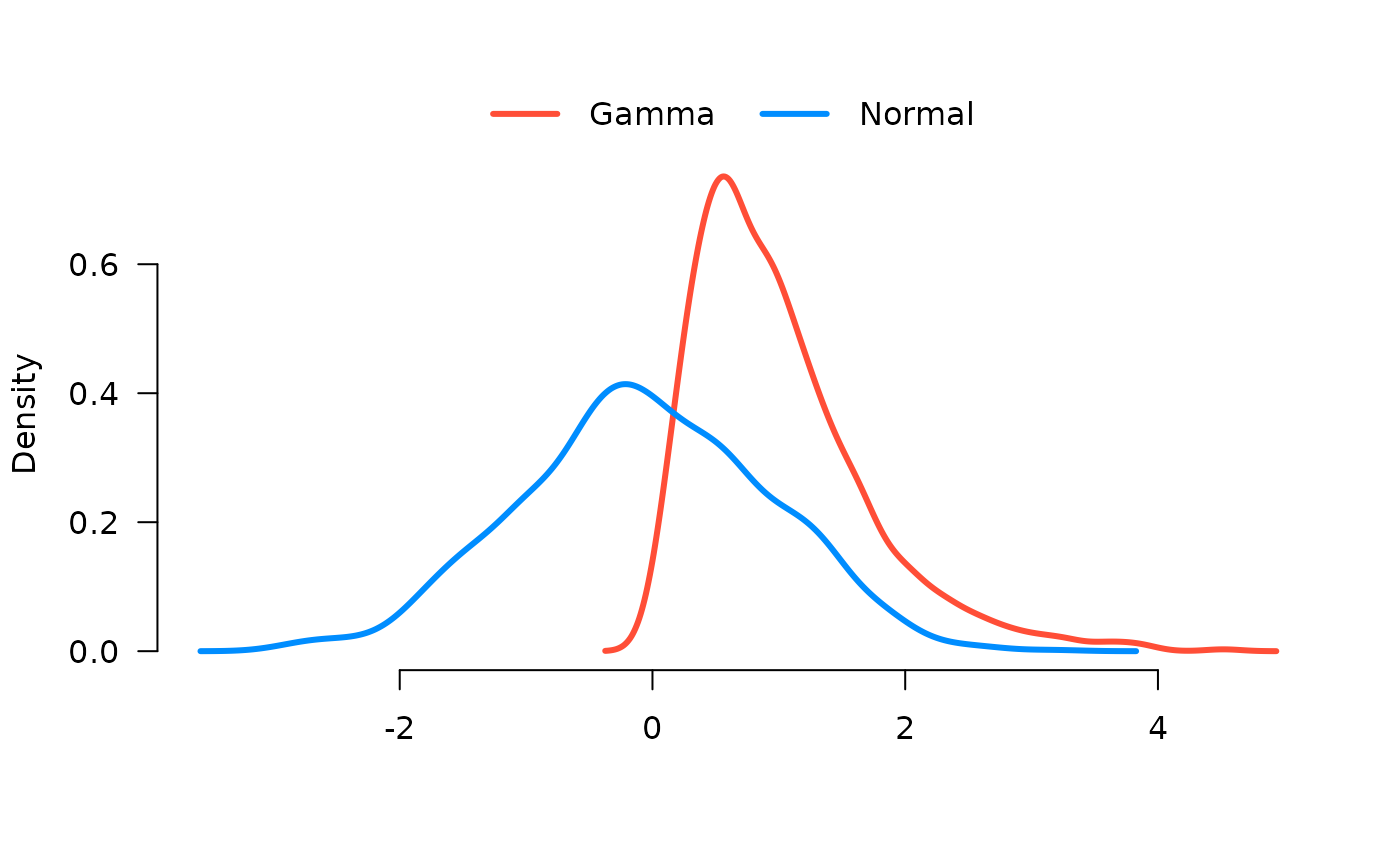
Density plot
dnplot.RdPrimarily intended for plotting posterior densities
Usage
dnplot(
  M,
  labs,
  pos = FALSE,
  lwd = 3,
  bty = "n",
  lty = 1,
  col = pal(p),
  ylab = "Density",
  xlab = "",
  las = 1,
  dens.par = NULL,
  ...
)
Arguments
- M
A vector or matrix of values upon which the density plot is based; if a matrix, separate densities will be estimated and plotted for each column
- labs
If supplied, a legend is printed; order of
labsshould correspond to columns ofM- pos
Are the densities strictly positive? If so, a boundary correction is applied. Default: FALSE
- lwd, bty, lty, col, xlab, ylab, las
Plotting options, as in
par()- dens.par
Additional arguments to
density()- ...
Additional arguments to
plot()


