Essentially a replacement for matplot.
Arguments
- x, y
A vector (x) and matrix (y); if only x is provided, it is
taken to be the matrix of responses and 1:n used as the horizontal axis
Examples
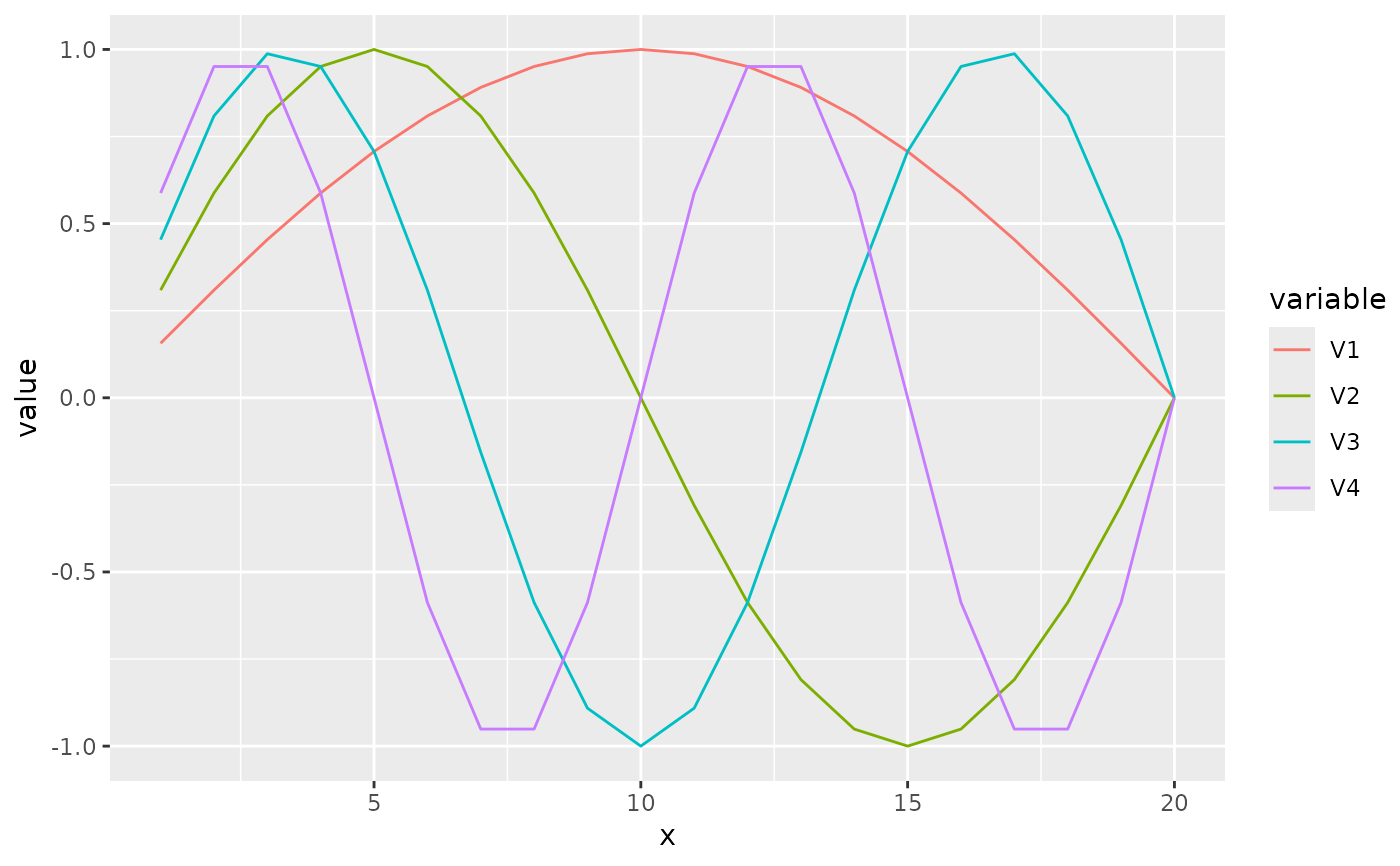
sines <- outer(1:20, 1:4, function(x, y) sin(x / 20 * pi * y))
ggmat(sines)
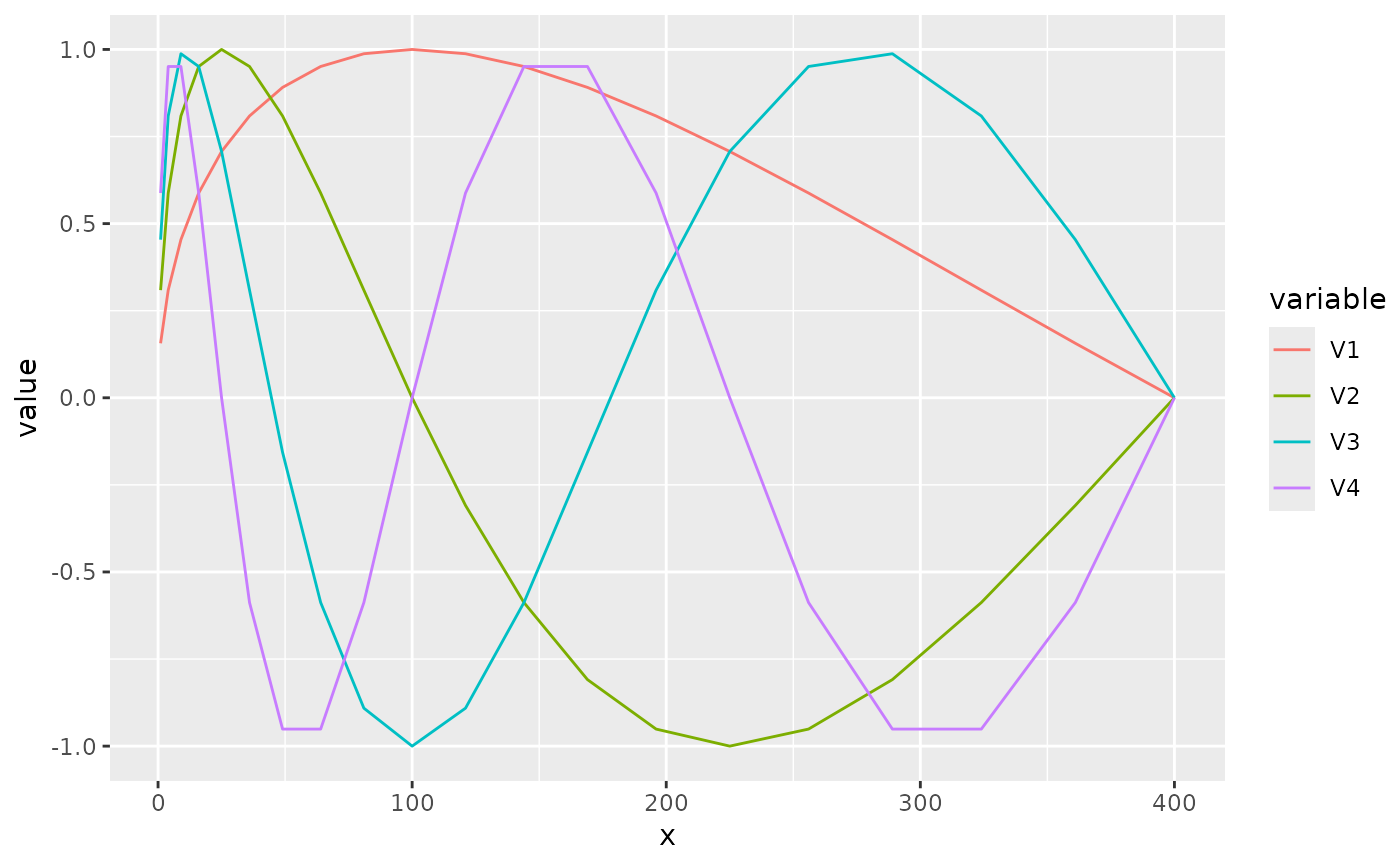
 ggmat((1:20)^2, sines)