Take a color and make it duller
grayCol.RdTake a color and make it duller
Examples
grayCol('red', 0.5)
#> [1] "#DF5F5F"
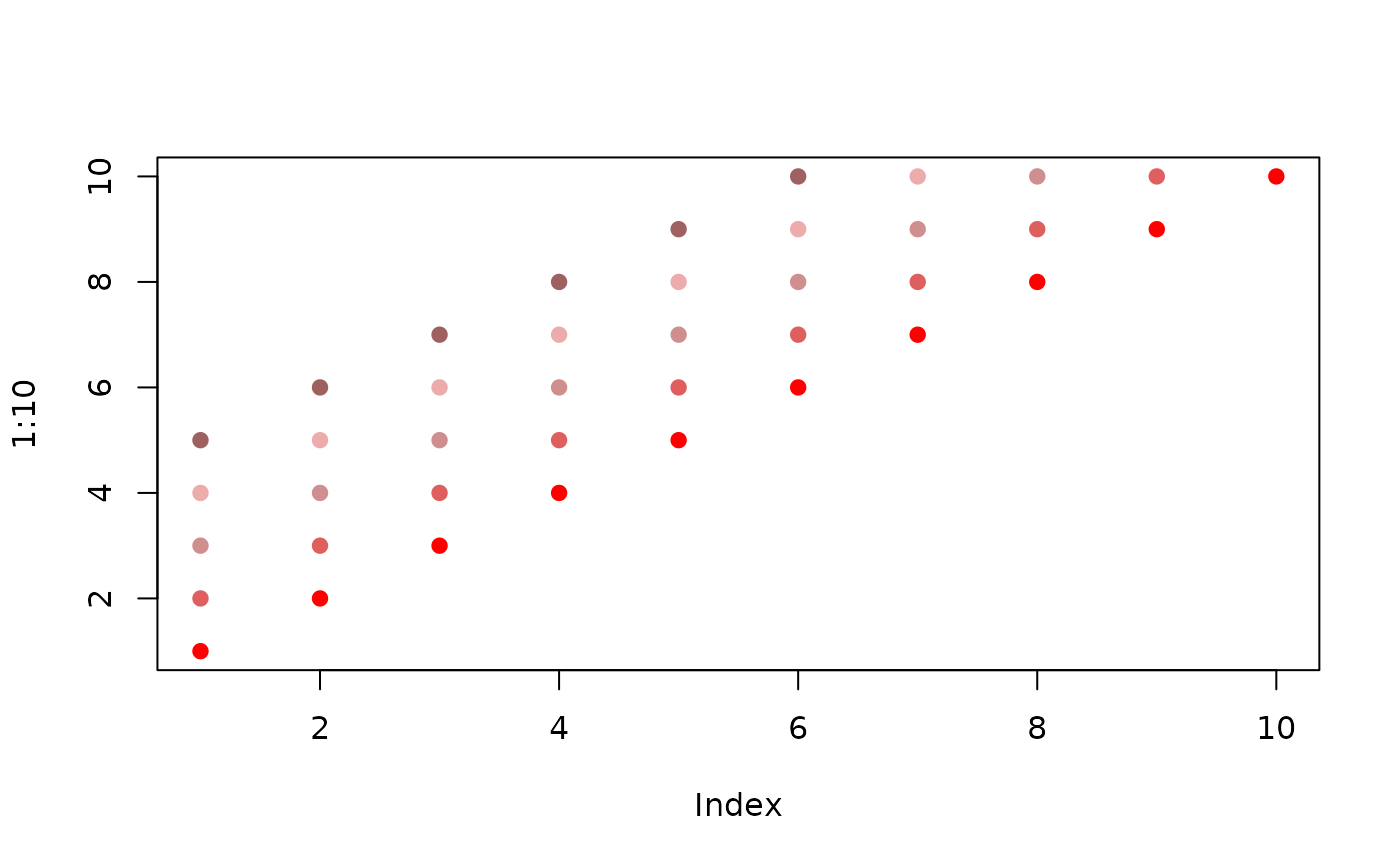
plot(1:10, pch=19, col='red')
points(2:10, pch=19, col=grayCol('red', 0.5))
points(3:10, pch=19, col=grayCol('red', 0.75))
points(4:10, pch=19, col=grayCol('red', 0.75, 0.1))
points(5:10, pch=19, col=grayCol('red', 0.75, 0.5))


grayCol(c('blue', 'red', 'green'), c(0.75, 0, 0.75), darkness=0.1)
#> [1] "#ACACEC" "#FF0000" "#ACECAC"
plot(1:3, pch=19, col=.Last.value)
#> Warning: supplied color is neither numeric nor character
