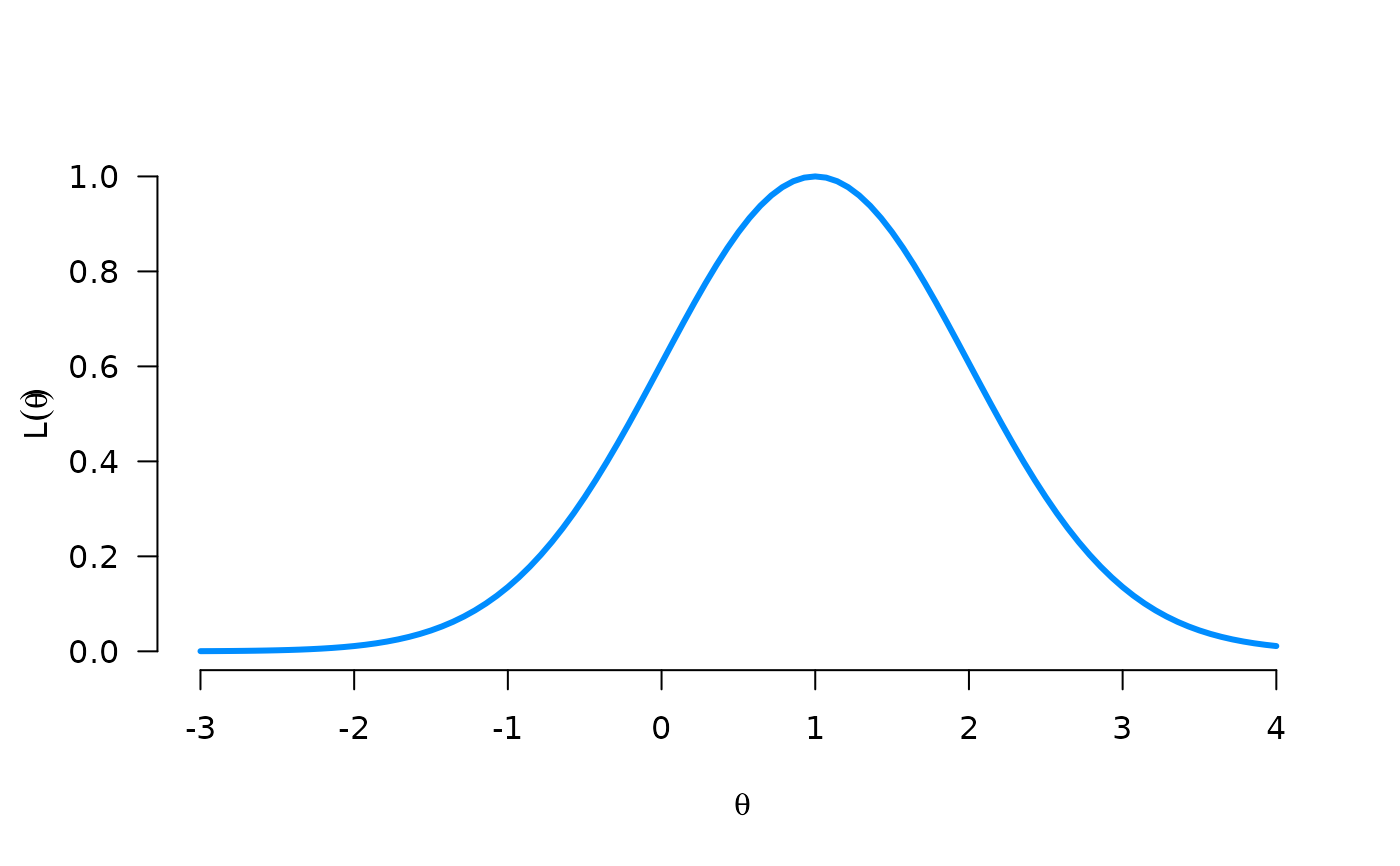
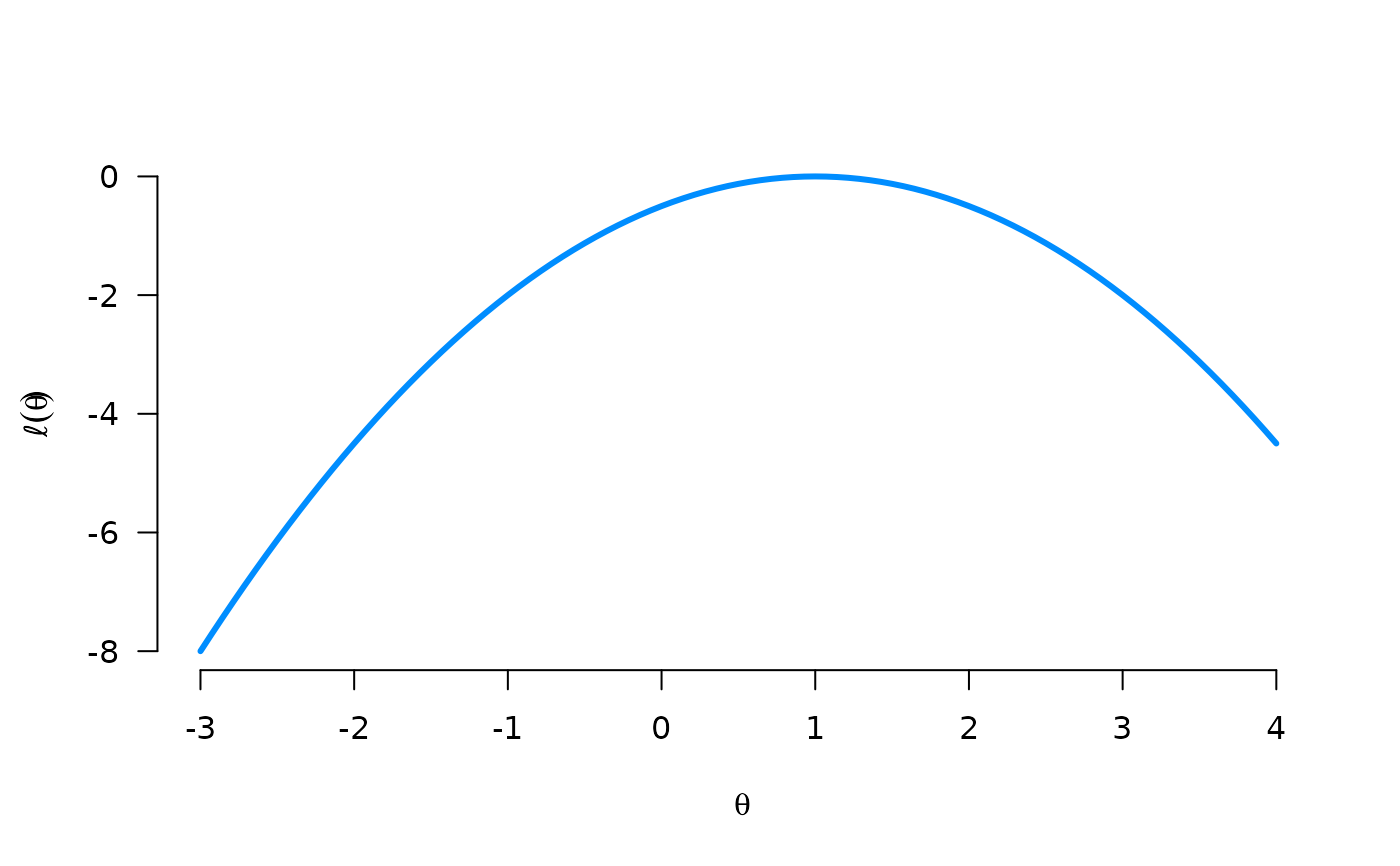
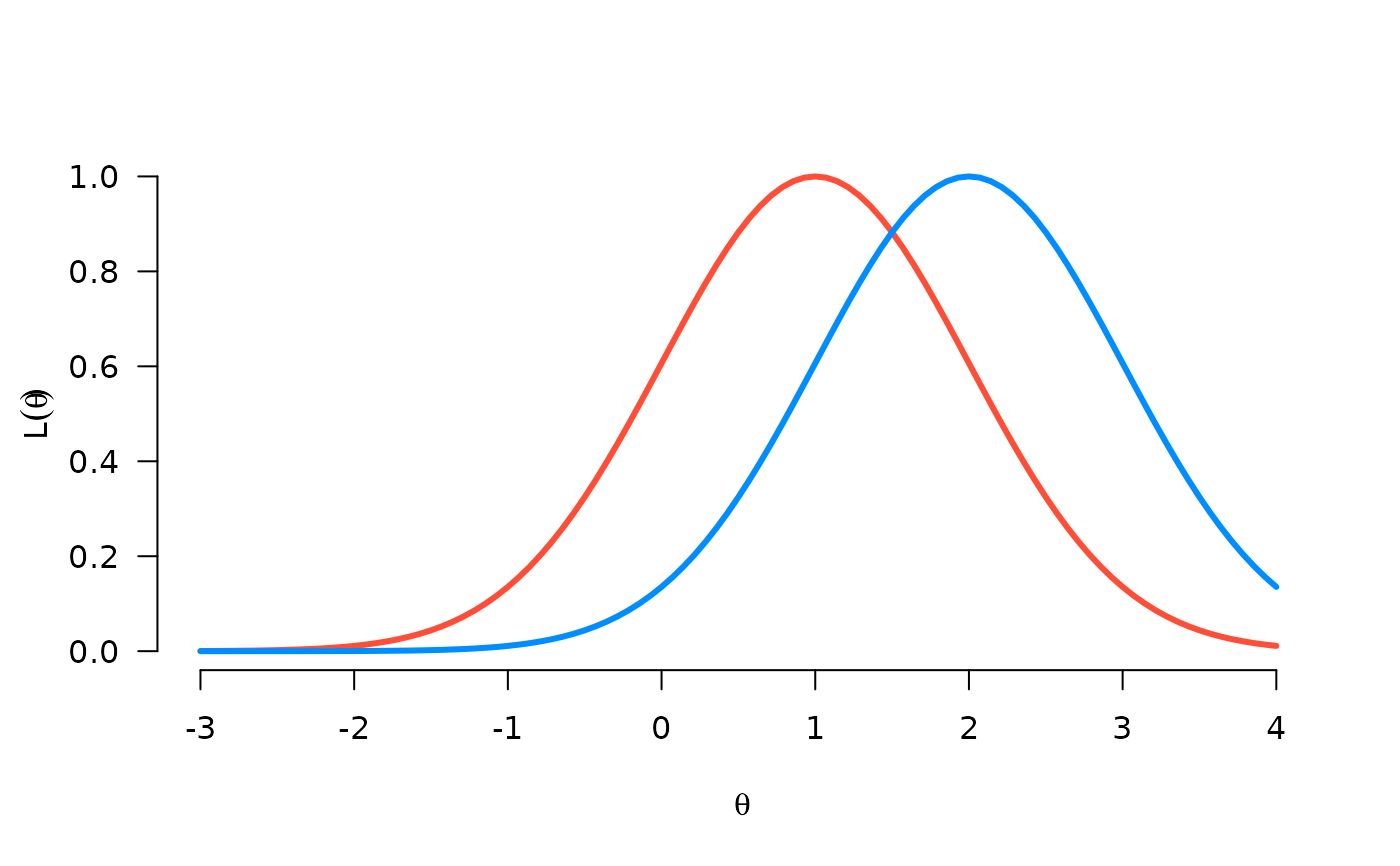
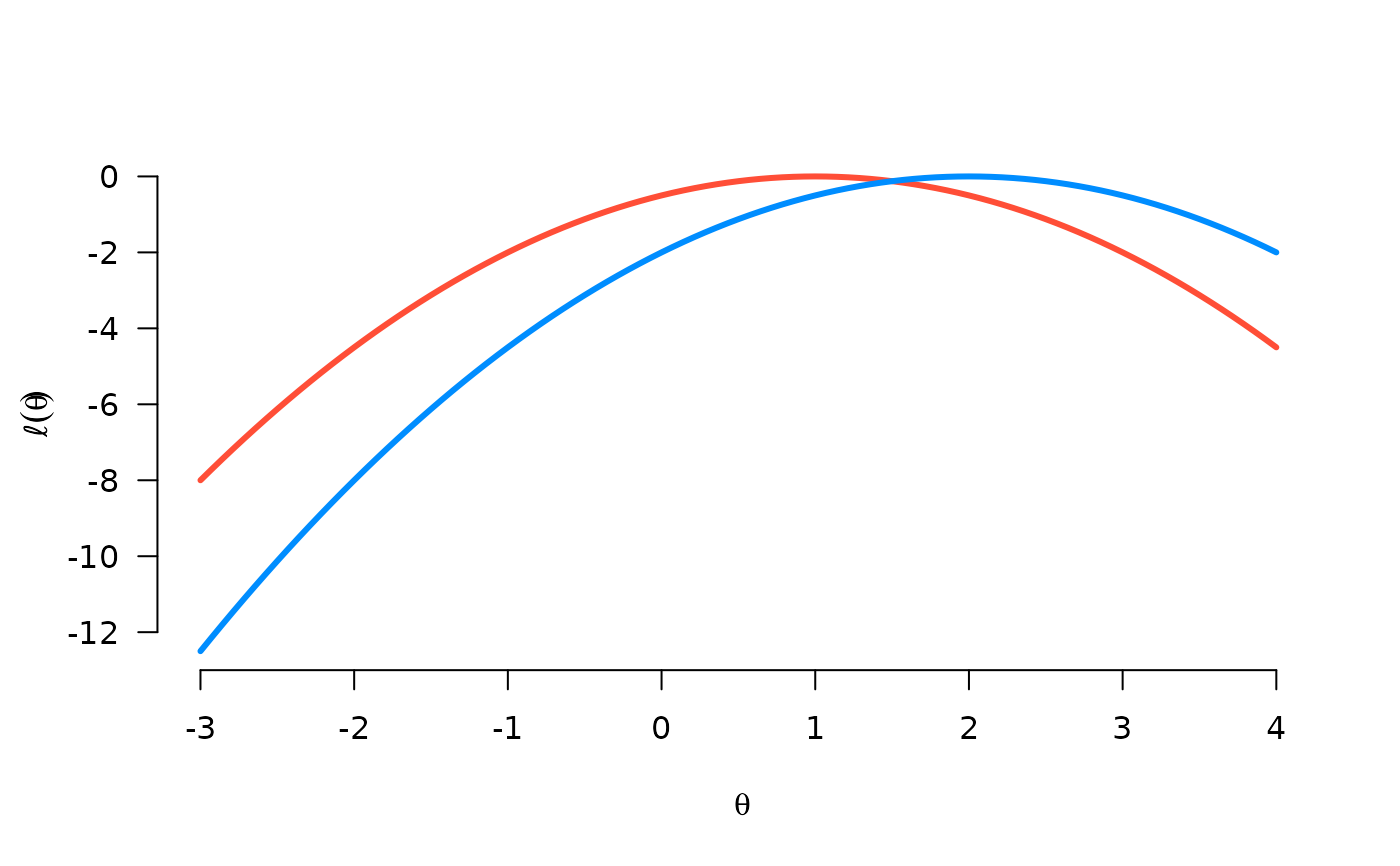
Plot likelihood function
likelihood_plot.RdplotL() plots the likelihood, plotl() plots the log-likelihood
Usage
plotL(
  x,
  l,
  xlab = expression(theta),
  ylab = expression(L(theta)),
  bty = "n",
  col,
  add = FALSE,
  ...
)

plotl(
  x,
  l,
  xlab = expression(theta),
  ylab = expression("\u2113" * (theta)),
  bty = "n",
  col,
  add = FALSE,
  ...
)
Arguments
- x
Parameter values (on x axis)
- l
Likelihood / log-likelihood (on y axis)
- xlab
Default: theta
- ylab
Default: L(theta)
- bty
Default: no boundary box
- col
Color (or vector of colors, if
lis a matrix)- add
Add to existing plot? Default: FALSE
- ...
Further arguments to
plot()


