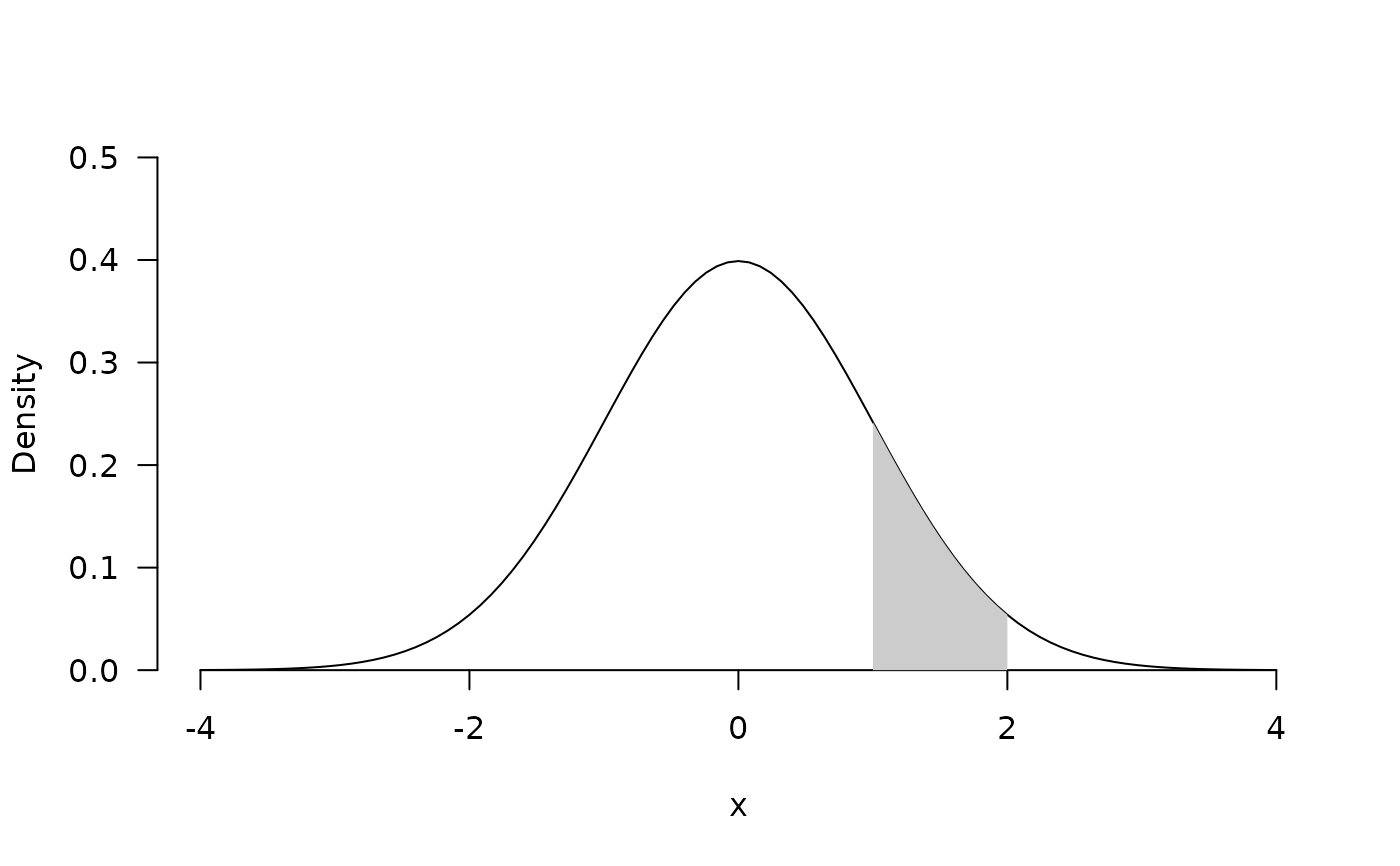
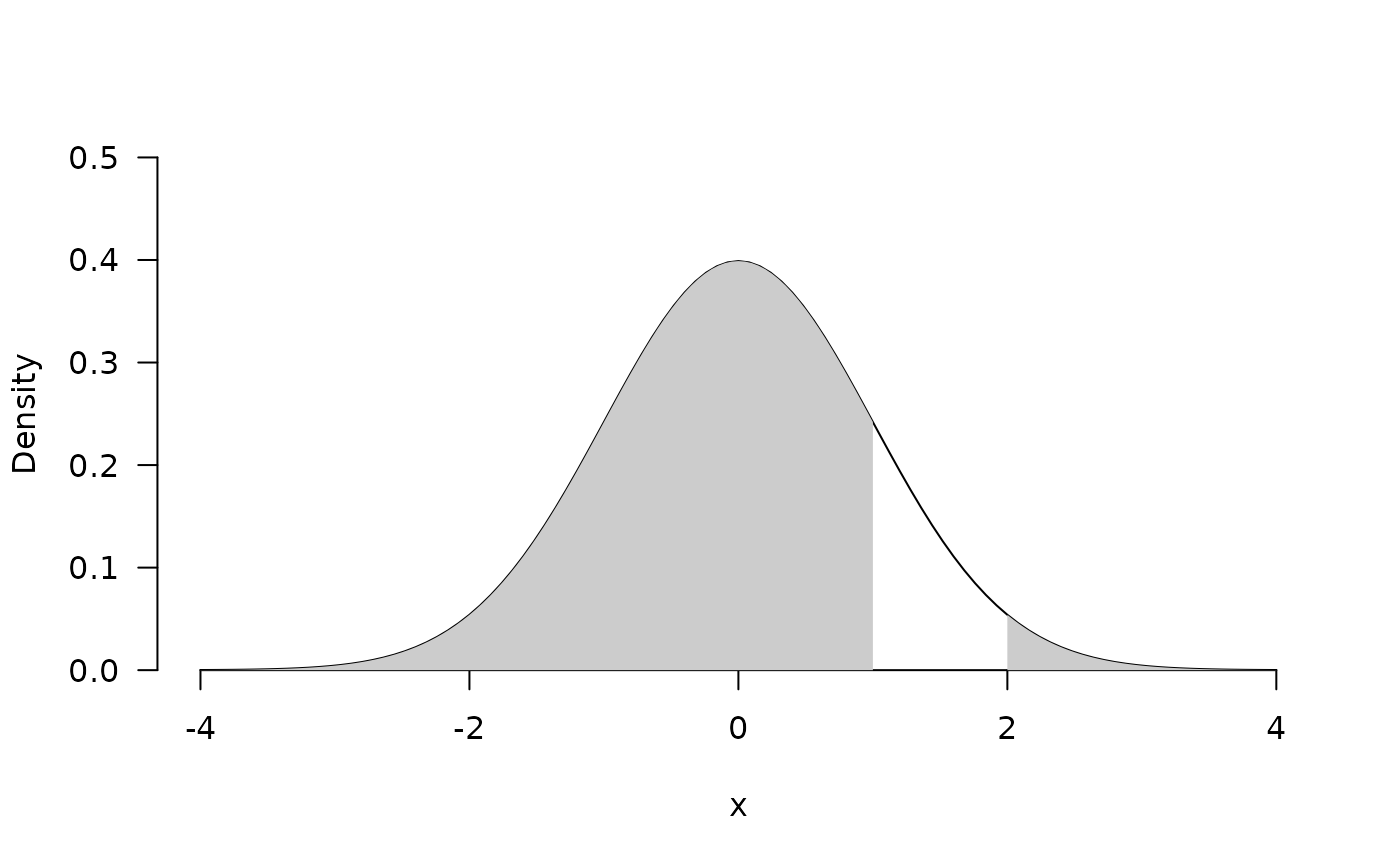
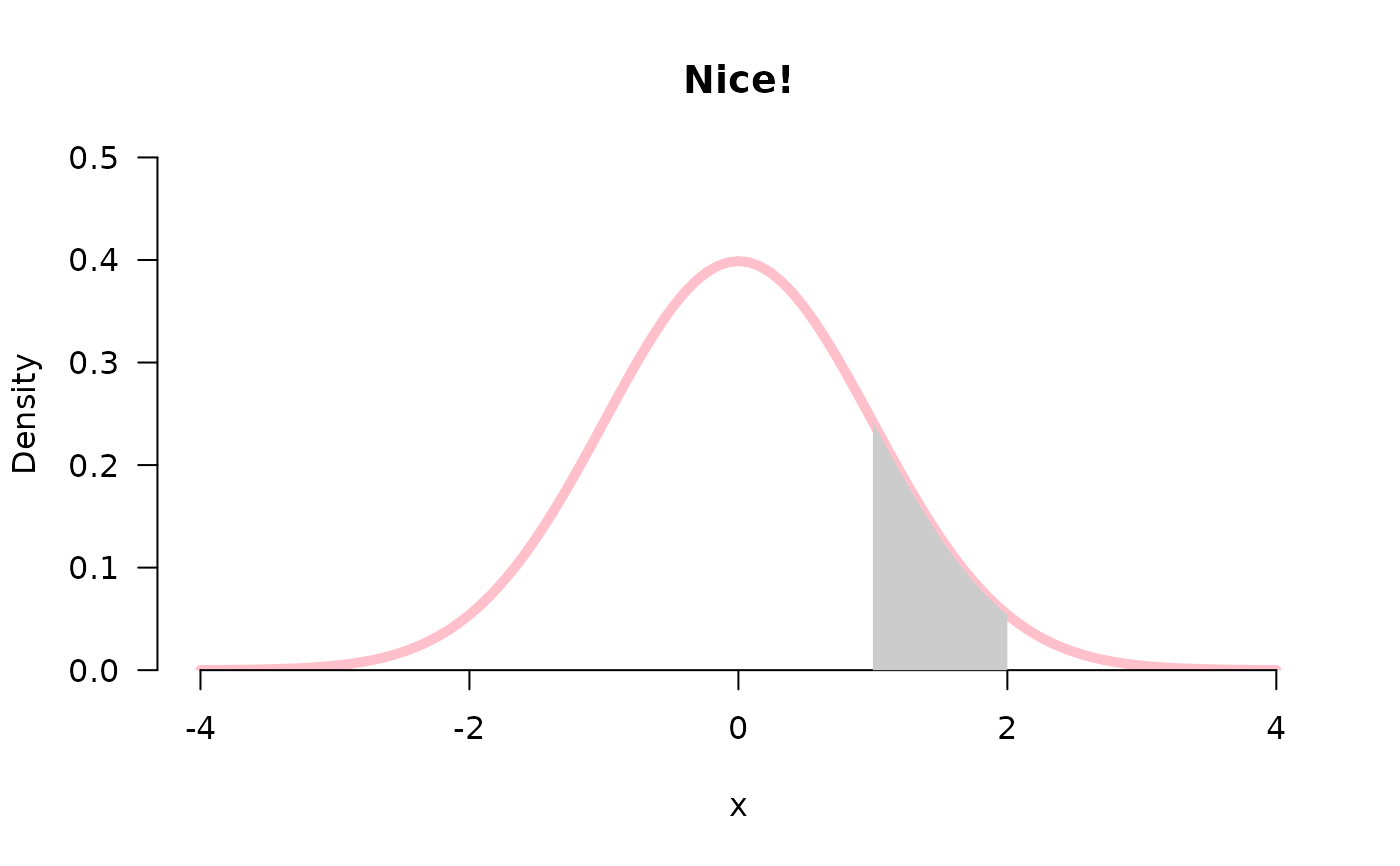
Draw a normal curve and shade area under an interval (probability)
normProb.RdDraw a normal curve and shade area under an interval (probability)
Arguments
- a, b
Endpoints of the interval
- outside
Shade the area outside (a,b)? Default is FALSE (i.e., shade the area inside a and b)
- ...
Additional arguments to
plot()


