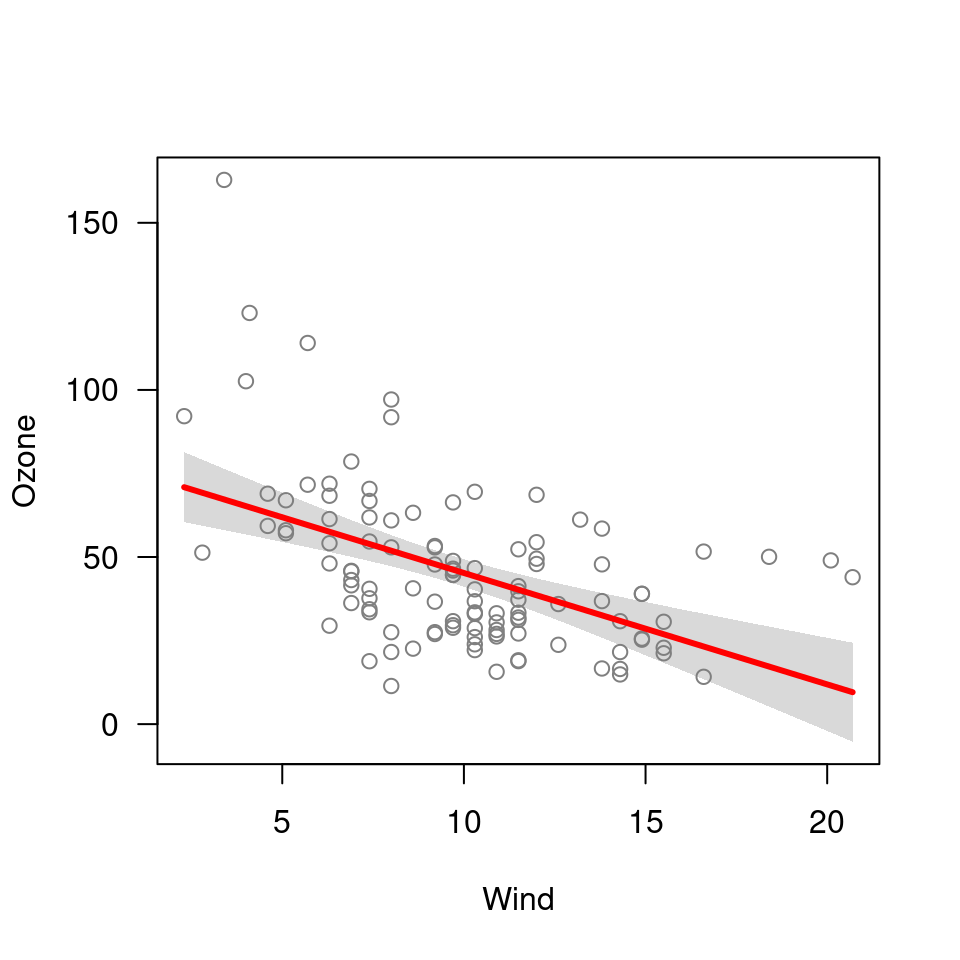
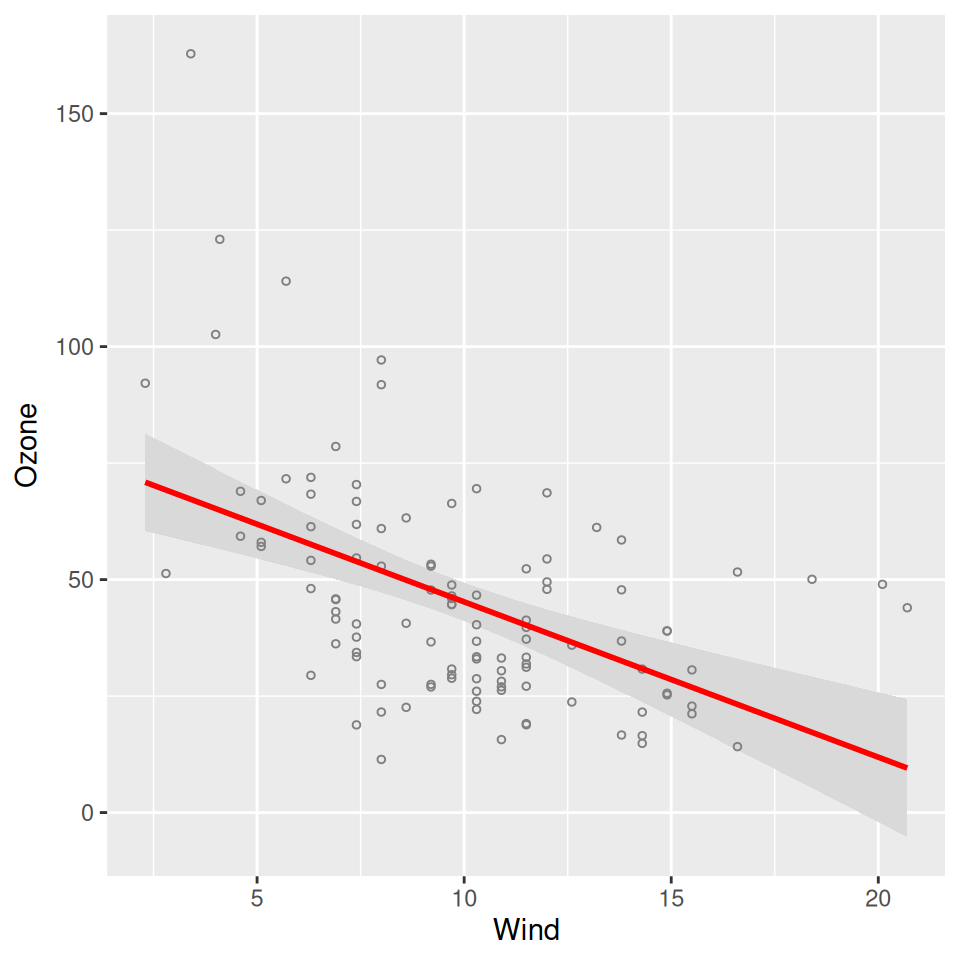
Default plots contain a confidence band, prediction line, and partial residuals. Factors,
transformations, conditioning, interactions, and a variety of other options are supported. The
plot.visreg() function accepts a visreg object as calculated by visreg() and creates the
plot.
Usage
# S3 method for class 'visreg'
plot(
  x,
  overlay = FALSE,
  print_cond = FALSE,
  partial = identical(x$meta$trans, I),
  band = TRUE,
  rug = 0,
  jitter = FALSE,
  strip_names = is.numeric(x$fit[, x$meta$by]),
  top = c("line", "points"),
  line = NULL,
  fill = NULL,
  points = NULL,
  gg = TRUE,
  ...
)

# S3 method for class 'visreg_list'
plot(x, ...)

# S3 method for class 'visreg_plot_list'
print(x, ...)
Arguments
- x
A
visregorvisreg_listobject; seevisreg().- overlay
By default, when
byis specified, separate panels are used to display each cross-section. Ifoverlay=TRUE, these cross-sections are overlaid on top of each other in a single plot.- print_cond
If
print_cond=TRUE, the explanatory variable values conditioned on in a conditional plot are printed to the console (default:FALSE). Ifprint_cond=TRUEandtype="contrast", the conditions will still be printed, but they have no bearing on the plot unless interactions are present.- partial
If
partial=TRUE(the default), partial residuals are shown on the plot.- band
If
band=TRUE(the default), confidence bands are shown on the plot.- rug
Controls the appearance of a rug along the horizontal axis:
rug=0/FALSE: No rug (default)rug=1/TRUE: Basic rug is drawn along the bottom axisrug=2: Separate rugs drawn on the top for observations with positive residuals and on the bottom for observations with negative residuals.
- jitter
If
jitter=TRUE, a small amount of random noise is added to the horizontal position of partial residuals (and, if drawn, the rug). Potentially useful if many observations have exactly the same value. Only applies whenxvaris continuous; for factorxvar, the horizontal spacing of points is already controlled byvisregand this argument has no effect. Default isFALSE.- strip_names
When
by=TRUE,strip_names=TRUEadds the name of thebyvariable to the strip at the top of each panel. Default isFALSEfor factors andTRUEfor numericbyvariables.strip_namescan also be a character vector, in which case it replaces the strip names altogether with values chosen by the user.- top
By default, the fitted line is plotted on top of the partial residuals; usually this is preferable, but it does run the risk of obscuring certain residuals. To change this behavior and plot the partial residuals on top, specify
top='points'.- line
List of parameters to pass to
ggplot2::geom_line()(continuousxvar) orggplot2::geom_crossbar()(factorxvar) when the fitted line is plotted.- fill
List of parameters to pass to
ggplot2::geom_ribbon()(continuousxvar) orggplot2::geom_crossbar()(factorxvar) when shaded confidence regions are plotted.- points
List of parameters to pass to
ggplot2::geom_point()(continuousxvar) orggplot2::geom_jitter()(factorxvar) when partial residuals are plotted.- gg
Deprecated, no longer has any effect.
- ...
Not used; present only because
plot()is a generic function. An error is raised if any arguments are passed here.
Value
A ggplot object, or if x is a visreg_list(), a list of ggplot objects.
Details
If x is a visreg_list(), plot.visreg_list() is dispatched instead; it simply calls
plot.visreg() on each element in turn, passing along the same arguments to each element.
References
Breheny P and Burchett W. (2017) Visualization of regression models using visreg. R Journal, 9: 56-71. doi:10.32614/RJ-2017-046
See also
visreg2d for creating visreg objects, and the
options vignette for examples.