The Birthwt data contains 189 observations, 16 predictors, and an
outcome, birthweight, available both as a continuous measure and a binary
indicator for low birth weight.The data were collected at Baystate Medical
Center, Springfield, Mass during 1986. This data frame is a
reparameterization of the birthwt data frame from the MASS package.
Usage
data(Birthwt)Format
The Birthwt object is a list containing four elements (X, bwt, low, and group):
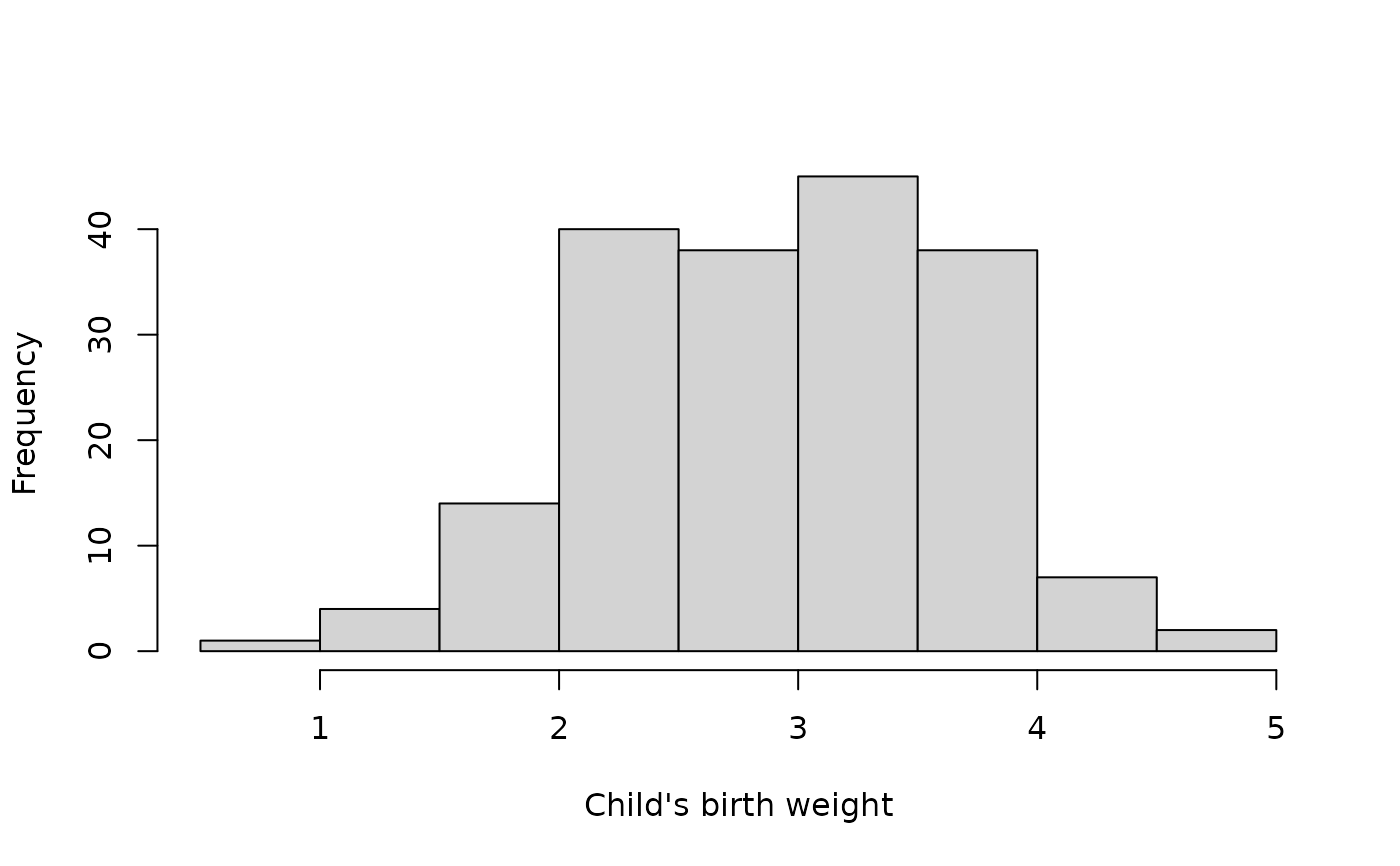
- bwt
Birth weight in kilograms
- low
Indicator of birth weight less than 2.5kg
- group
Vector describing how the columns of X are grouped
- X
A matrix with 189 observations (rows) and 16 predictor variables (columns).
The matrix X contains the following columns:
- age1,age2,age3
Orthogonal polynomials of first, second, and third degree representing mother's age in years
- lwt1,lwt2,lwt3
Orthogonal polynomials of first, second, and third degree representing mother's weight in pounds at last menstrual period
- white,black
Indicator functions for mother's race; "other" is reference group
- smoke
Smoking status during pregnancy
- ptl1,ptl2m
Indicator functions for one or for two or more previous premature labors, respectively. No previous premature labors is the reference category.
- ht
History of hypertension
- ui
Presence of uterine irritability
- ftv1,ftv2,ftv3m
Indicator functions for one, for two, or for three or more physician visits during the first trimester, respectively. No visits is the reference category.
References
Venables, W. N. and Ripley, B. D. (2002). Modern Applied Statistics with S. Fourth edition. Springer.
Hosmer, D.W. and Lemeshow, S. (1989) Applied Logistic Regression. New York: Wiley