Plots the cross-validation curve from a cv.grpreg object, along with
standard error bars.
Arguments
- x
A
cv.grpregobject.- log.l
Should horizontal axis be on the log scale? Default is TRUE.
- type
What to plot on the vertical axis.
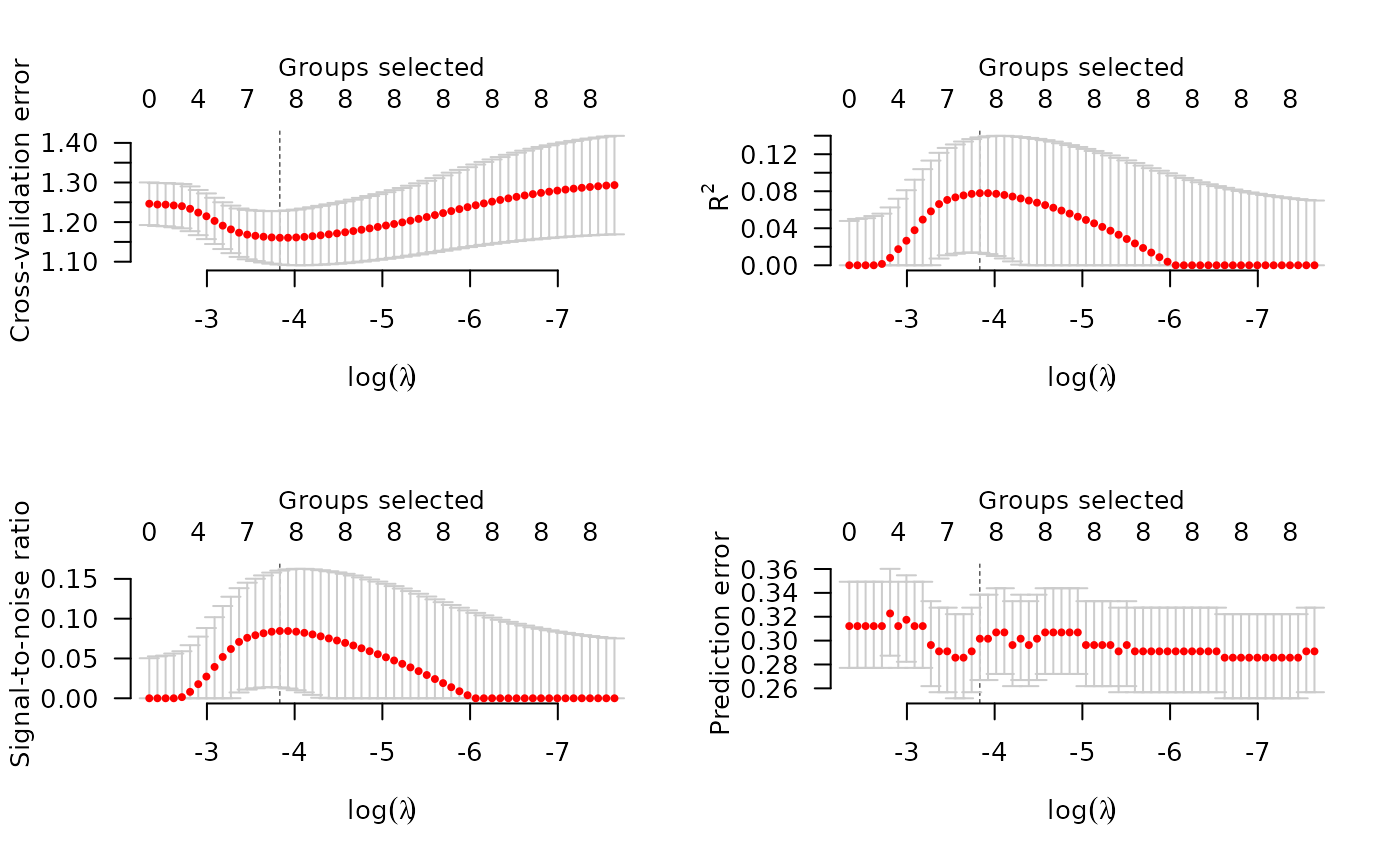
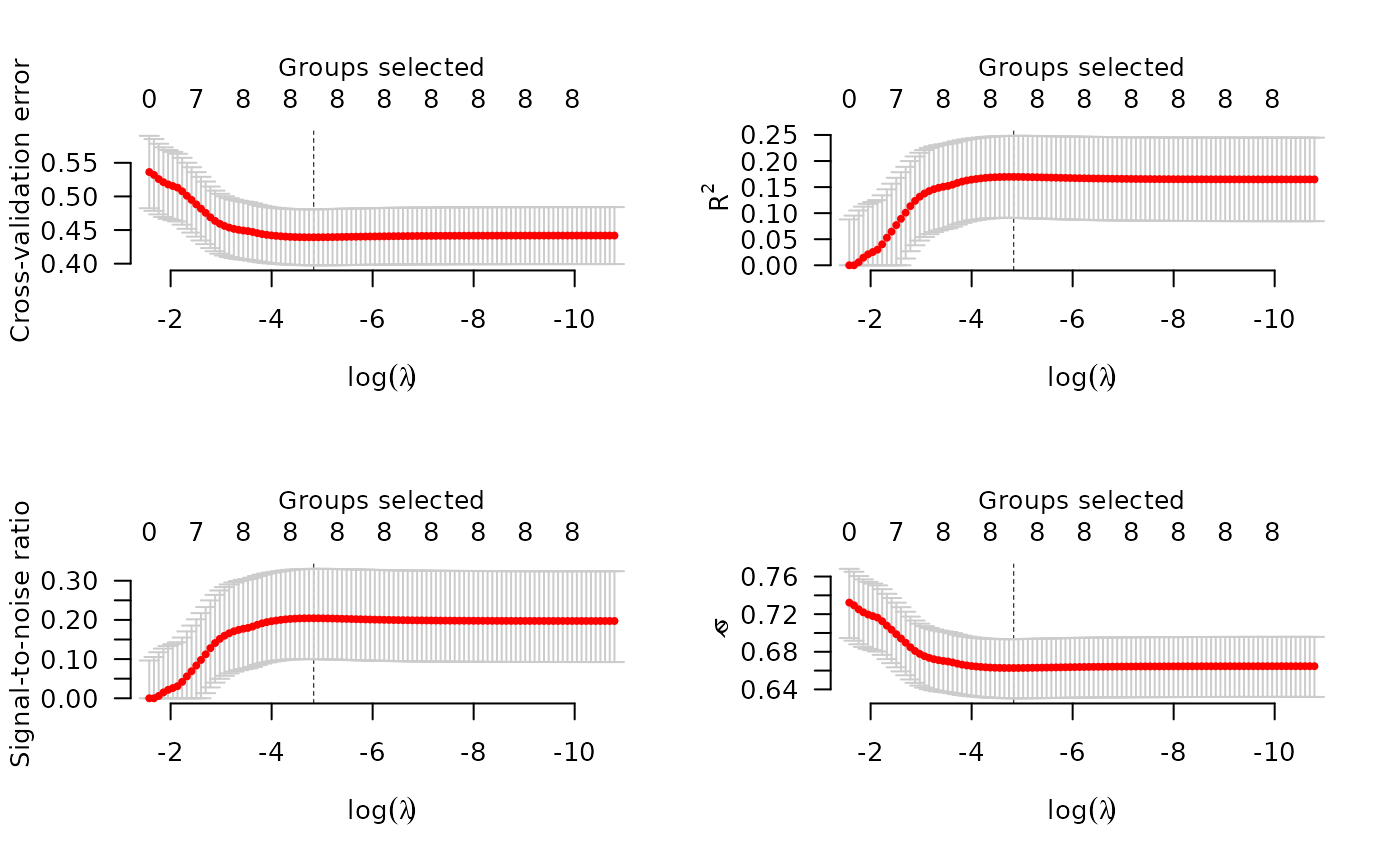
cveplots the cross-validation error (deviance);rsqplots an estimate of the fraction of the deviance explained by the model (R-squared);snrplots an estimate of the signal-to-noise ratio;scaleplots, forfamily="gaussian", an estimate of the scale parameter (standard deviation);predplots, forfamily="binomial", the estimated prediction error;allproduces all of the above.- selected
If
TRUE(the default), places an axis on top of the plot denoting the number of groups in the model (i.e., that contain a nonzero regression coefficient) at that value oflambda.- vertical.line
If
TRUE(the default), draws a vertical line at the value where cross-validaton error is minimized.- col
Controls the color of the dots (CV estimates).
- ...
Other graphical parameters to
plot
Details
Error bars representing approximate +/- 1 SE (68\
plotted along with the estimates at value of lambda. For rsq
and snr, these confidence intervals are quite crude, especially near
zero, and will hopefully be improved upon in later versions of
grpreg.
Examples
# Birthweight data
data(Birthwt)
X <- Birthwt$X
group <- Birthwt$group

# Linear regression
y <- Birthwt$bwt
cvfit <- cv.grpreg(X, y, group)
plot(cvfit)
op <- par(mfrow=c(2,2))
plot(cvfit, type="all")


## Logistic regression
y <- Birthwt$low
cvfit <- cv.grpreg(X, y, group, family="binomial")
par(op)
plot(cvfit)
par(mfrow=c(2,2))
plot(cvfit, type="all")
## Logistic regression
y <- Birthwt$low
cvfit <- cv.grpreg(X, y, group, family="binomial")
par(op)
plot(cvfit)
par(mfrow=c(2,2))
plot(cvfit, type="all")