visreg tries to set up pleasant-looking default options, but everything can be tailored to user specifications. This article covers options that must be controlled through visreg() itself; other aspects of the plot, like titles, transforming axes, adding annotations, etc., can all be handled using the usual ggplot2 syntax. For the plots below, we work from this general model:
Turning on/off plot components
By default, visreg includes the fitted line, confidence bands, and partial residuals, but the residuals and the bands can be turned off:
visreg(fit, "Solar.R", band = FALSE)
visreg(fit, "Solar.R", partial = FALSE)
visreg(fit, "Solar.R", partial = FALSE, rug = TRUE)
Appearance of points, lines, and bands
Specifying col='red' won’t work, because visreg can’t know whether you’re trying to change the color of the line, the band, or the points. These options must be specified through separate parameter lists:
-
line: Controls the appearance of the fitted line -
fill: Controls the appearance of the confidence band -
points: Controls the appearance of the partial residuals
Each of these is passed along to the underlying ggplot2 geom (geom_line/geom_ribbon/geom_point for a continuous x, or geom_errorbar/geom_tile/geom_jitter for a factor x), so any parameter that geom accepts can be specified:

Jittering
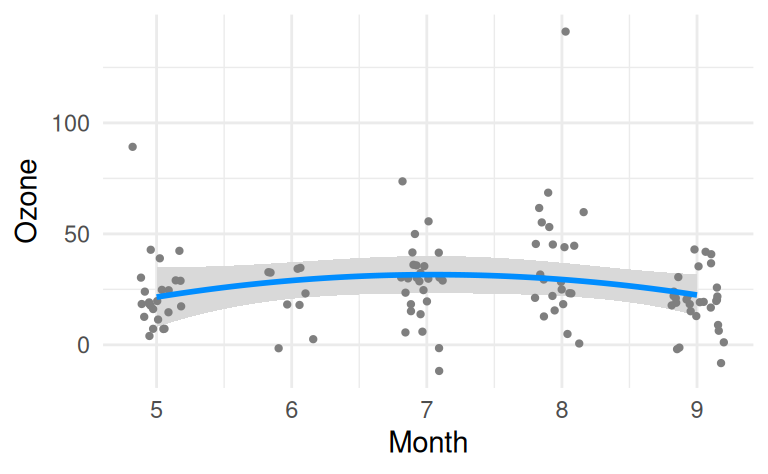
If there are many ties in a numeric variable x, jittering can be helpful way to avoid overplotting. Compare the following two plots:

Band width for factors
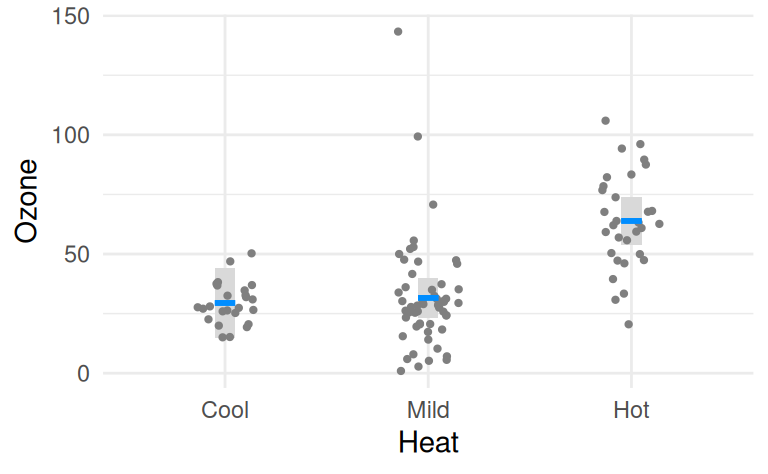
When x is a factor, the width of the confidence band (and its accompanying line) is controlled through the fill/line arguments’ width parameter:
visreg(fit, "Heat", line = list(width = 0.98), fill = list(width = 0.98))
visreg(fit, "Heat", line = list(width = 0.1), fill = list(width = 0.1))