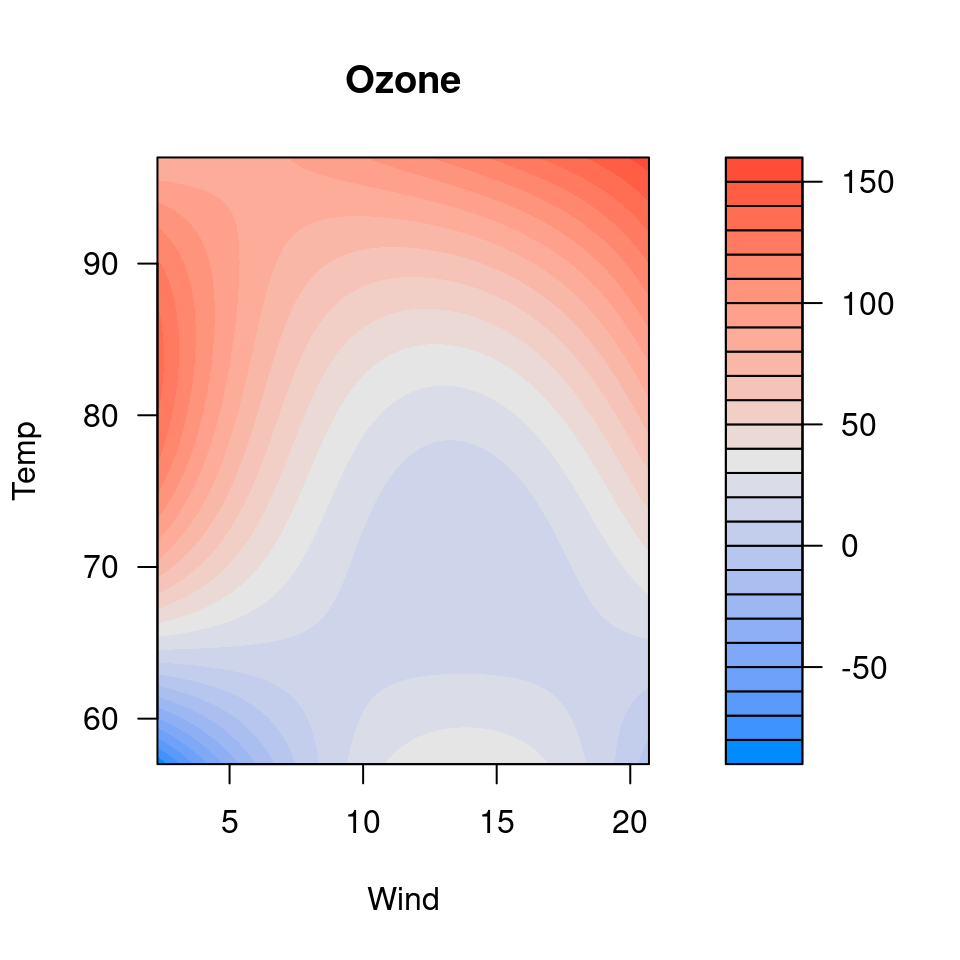
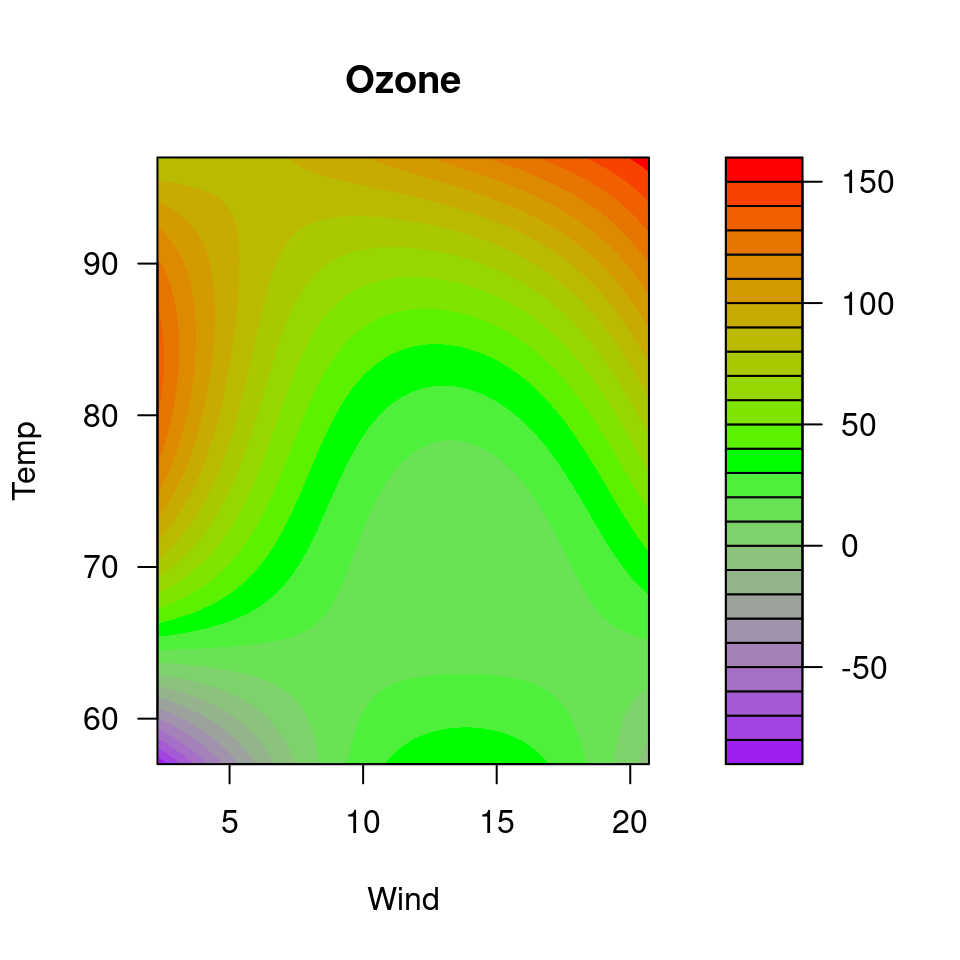
Plot method for visualizing how two variables interact to affect the response in regression
models, as a ggplot2 raster/contour plot.
Usage
# S3 method for class 'visreg2d'
plot(
  x,
  xlab = NULL,
  ylab = NULL,
  zlab = NULL,
  color,
  print_cond = FALSE,
  whitespace = 0.2,
  plot.type = NULL,
  ...
)
Arguments
- x
A
visreg2d()object.- xlab, ylab
Axis labels for predictors (default: variable name)
- zlab
Label for the color legend (default: outcome variable name)
- color
A vector of colors used to establish the color palette for the fill/legend.
- print_cond
If
print_cond==TRUE, the explanatory variable values conditioned on in a conditional plot are printed to the console (default:FALSE). Ifprint_cond==TRUEandtype=="contrast", the conditions will still be printed, but they have no bearing on the plot unless interactions are present.- whitespace
When
xvaroryvaris a factor,whitespacedetermines the amount of space in between the factors. Default is 0.2, meaning that 20 percent of the axis is whitespace.- plot.type
Deprecated, no longer has any effect. See vignette.
- ...
Not used.
Details
For 3-dimensional surface plots, see persp.visreg2d() (static) or rgl::persp3d()
(interactive, requires the rgl package).
References
Breheny P and Burchett W. (2017) Visualization of regression models using visreg. R Journal, 9: 56-71. doi:10.32614/RJ-2017-046
See also
visreg2d() for creating two-dimensional visreg objects, persp.visreg2d() for static 3D
surface plots, and the
surface plots vignette for examples
and details.