Similar to other predict methods, this function returns predictions from a fitted grpsurv object.
Arguments
- object
Fitted
grpsurvmodel object.- X
Matrix of values at which predictions are to be made. Not required for some
typevalues.- type
Type of prediction:
link: linear predictorsresponse: risk (i.e.,exp(link))survival: the estimated survival functionhazard: the estimated cumulative hazard functionmedian: median survival timeThe other options are all identical to their
grpreg()counterparts
- lambda
Regularization parameter at which predictions are requested. For values of
lambdanot in the sequence of fitted models, linear interpolation is used.- which
Indices of the penalty parameter
lambdaat which predictions are required. Default: all indices. Iflambdais specified, this will overridewhich.- ...
Not used.
Details
Estimation of baseline survival function conditional on the estimated values of beta is carried out according to the method described in Chapter 4.3 of Kalbfleisch and Prentice.
References
Kalbfleish JD and Prentice RL (2002). The Statistical Analysis of Failure Time Data, 2nd edition. Wiley.
Examples
data(Lung)
X <- Lung$X

y <- Lung$y
group <- Lung$group

fit <- grpsurv(X, y, group)
coef(fit, lambda=0.05)
#>         trt      karno1      karno2      karno3   diagtime1   diagtime2
#>  0.08037515 -6.17591904  0.78016422 -0.46524844  0.00000000  0.00000000
#>        age1        age2        age3       prior    squamous       small
#> -0.30698476  0.28311172 -0.98219083  0.00000000 -0.39419164  0.17559226
#>       adeno       large
#>  0.41116562 -0.18990837
head(predict(fit, X, type="link", lambda=0.05))
#>          1          2          3          4          5          6
#> -0.3797934 -0.5934333 -0.2596129 -0.3895304 -0.5881482  0.7865260
head(predict(fit, X, type="response", lambda=0.05))
#>         1         2         3         4         5         6
#> 0.6840027 0.5524274 0.7713501 0.6773749 0.5553547 2.1957550

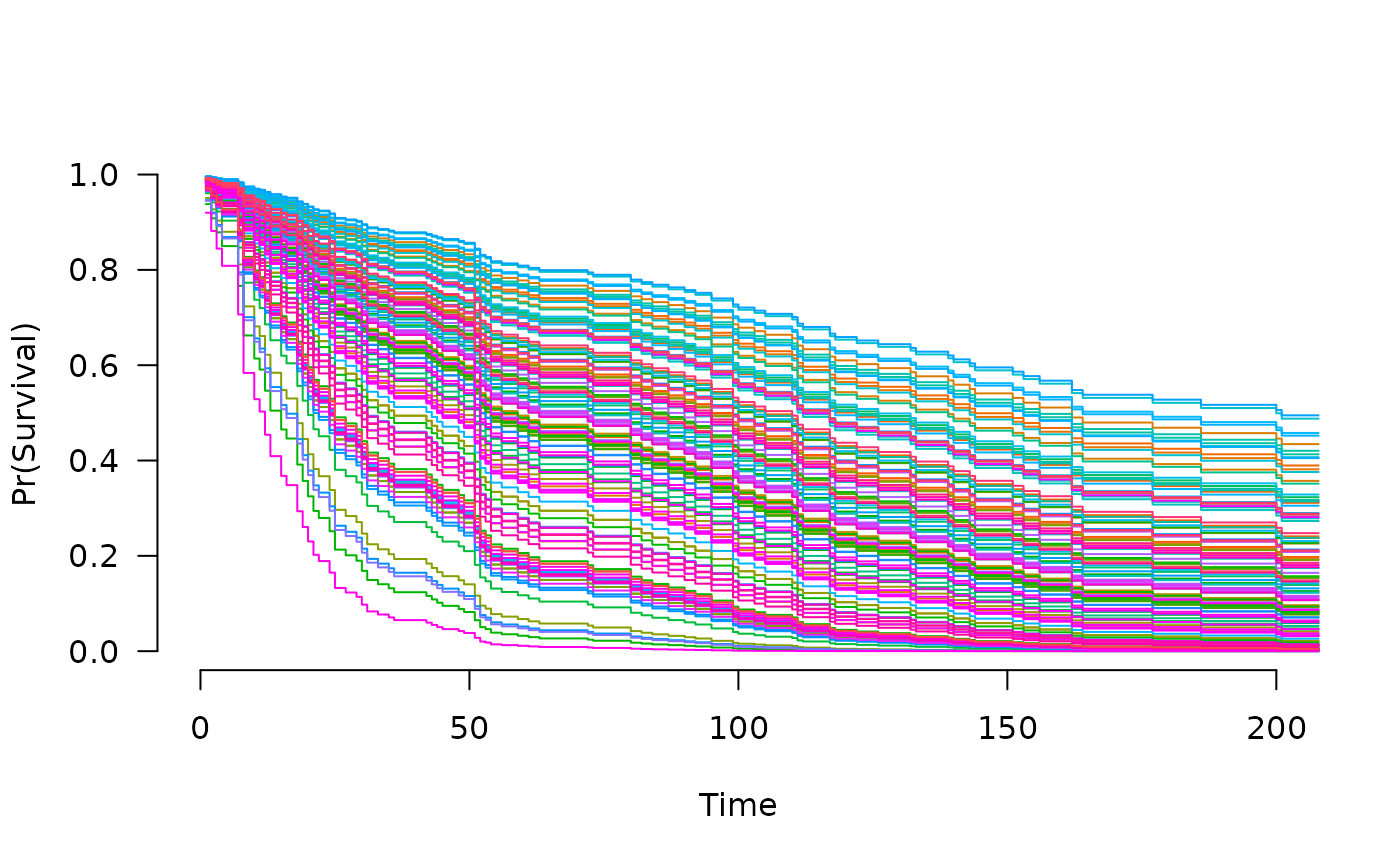
# Survival function
S <- predict(fit, X[1,], type="survival", lambda=0.05)
S(100)
#> [1] 0.5126102
S <- predict(fit, X, type="survival", lambda=0.05)
plot(S, xlim=c(0,200))


# Medians
predict(fit, X[1,], type="median", lambda=0.05)
#> [1] 105
M <- predict(fit, X, type="median")
M[1:10, 1:10]
#>       [,1] [,2] [,3] [,4] [,5] [,6] [,7] [,8] [,9] [,10]
#>  [1,]   80   80   80   73   80   80   84   87   90    92
#>  [2,]   80   80   80   82   84   90   95   95   99   100
#>  [3,]   80   80   80   73   80   80   84   87   90    92
#>  [4,]   80   80   80   73   80   80   84   87   90    92
#>  [5,]   80   80   80   82   84   90   95   95   99   100
#>  [6,]   80   61   54   52   51   48   45   43   42    36
#>  [7,]   80   72   61   59   56   56   56   56   56    56
#>  [8,]   80   82   87   90   95   99  103  110  111   112
#>  [9,]   80   73   72   63   63   72   72   73   80    80
#> [10,]   80   80   80   82   84   90   95   95   99   100

# Nonzero coefficients
predict(fit, type="vars", lambda=c(0.1, 0.01))
#> $`0.1`
#>   karno1   karno2   karno3 squamous    small    adeno    large
#>        2        3        4       11       12       13       14
#>
#> $`0.01`
#>       trt    karno1    karno2    karno3 diagtime1 diagtime2      age1      age2
#>         1         2         3         4         5         6         7         8
#>      age3     prior  squamous     small     adeno     large
#>         9        10        11        12        13        14
#>
predict(fit, type="nvars", lambda=c(0.1, 0.01))
#>  0.1 0.01
#>    7   14