R/plot-rfeat.R
plot.rfeat.Rd
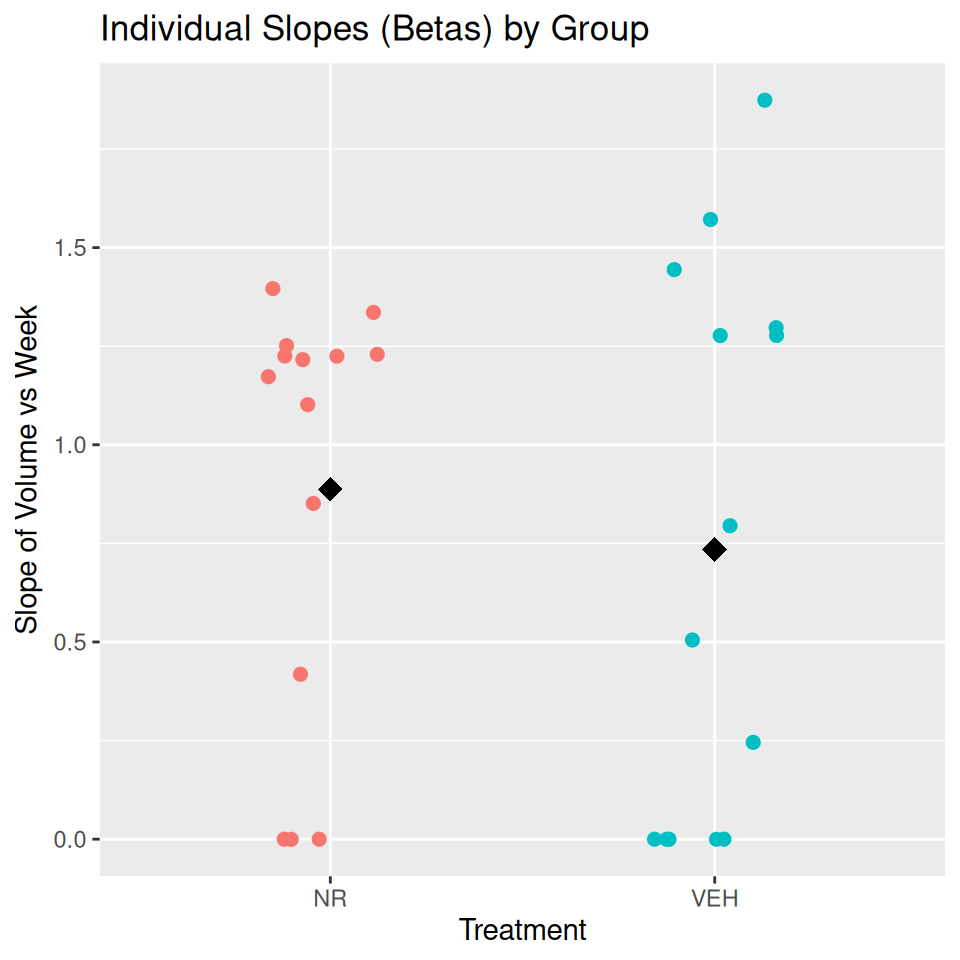
Plot based on rfeat analysis
# S3 method for class 'rfeat'
plot(x, ...)
An rfeat object
Other parameters
A plot
example <- rfeat(data = breast,
id = "ID",
time = "Week",
measure = "Volume",
group = "Treatment",
comparison = "t.test")
plot(example)