Static 3D perspective plot for a visreg2d object
Source:R/persp-visreg2d.R, R/plot-visreg_list.R
persp.visreg2d.Rdpersp() method for visreg2d() objects: draws a static 3-dimensional perspective plot of the
fitted surface, using base R's graphics::persp().
Arguments
- x
A
visreg2d()object.- xlab, ylab
Axis labels for predictors (default: variable name)
- zlab
Axis label for outcome (default: variable name)
- color
The color of the surface.
- whitespace
When
xvaroryvaris a factor,whitespacedetermines the amount of space in between the factors. Default is 0.2, meaning that 20 percent of the axis is whitespace.- ...
Additional graphical parameters, passed to
graphics::persp().
Value
The viewing transformation matrix, invisibly; see graphics::persp().
Details
For an interactive version that can be rotated with the mouse, see rgl::persp3d() (requires the
rgl package). For a 2-dimensional raster/contour plot, see plot.visreg2d().
References
Breheny P and Burchett W. (2017) Visualization of regression models using visreg. R Journal, 9: 56-71. doi:10.32614/RJ-2017-046
See also
visreg2d() for creating two-dimensional visreg objects, plot.visreg2d() for the
2-dimensional raster/contour plot, and the
surface plots vignette for examples
and details.
Examples
fit <- lm(
Ozone ~ Solar.R + Wind + Temp +
I(Wind^2) + I(Temp^2) + I(Wind * Temp) +
I(Wind * Temp^2) + I(Temp * Wind^2) +
I(Temp^2 * Wind^2),
data = airquality
)
v <- visreg2d(fit, x = "Wind", y = "Temp", plot = FALSE)
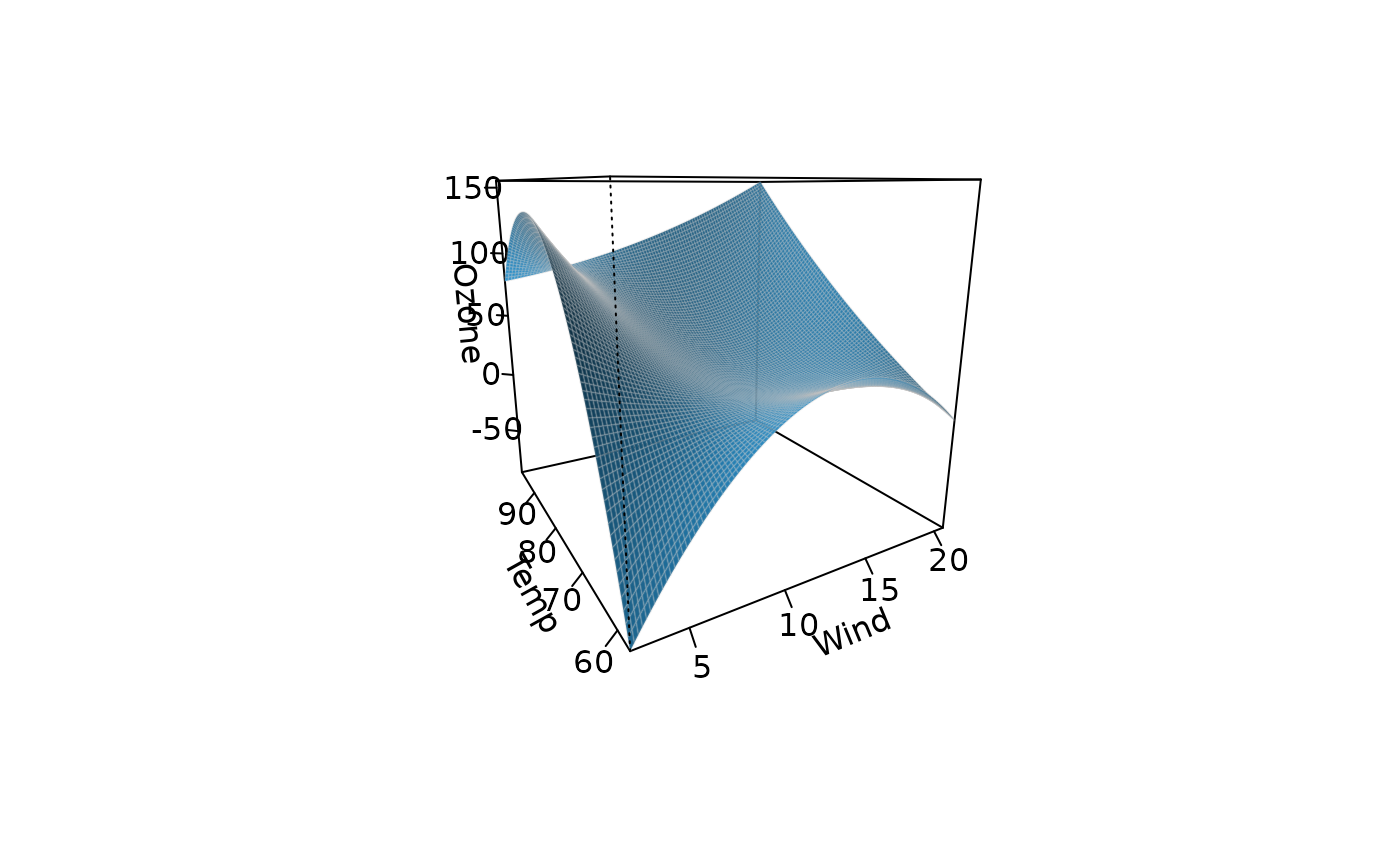
persp(v)
 airquality$Heat <- cut(airquality$Temp, 3, labels = c("Cool", "Mild", "Hot"))
fit2 <- lm(Ozone ~ Solar.R + Wind * Heat, data = airquality)
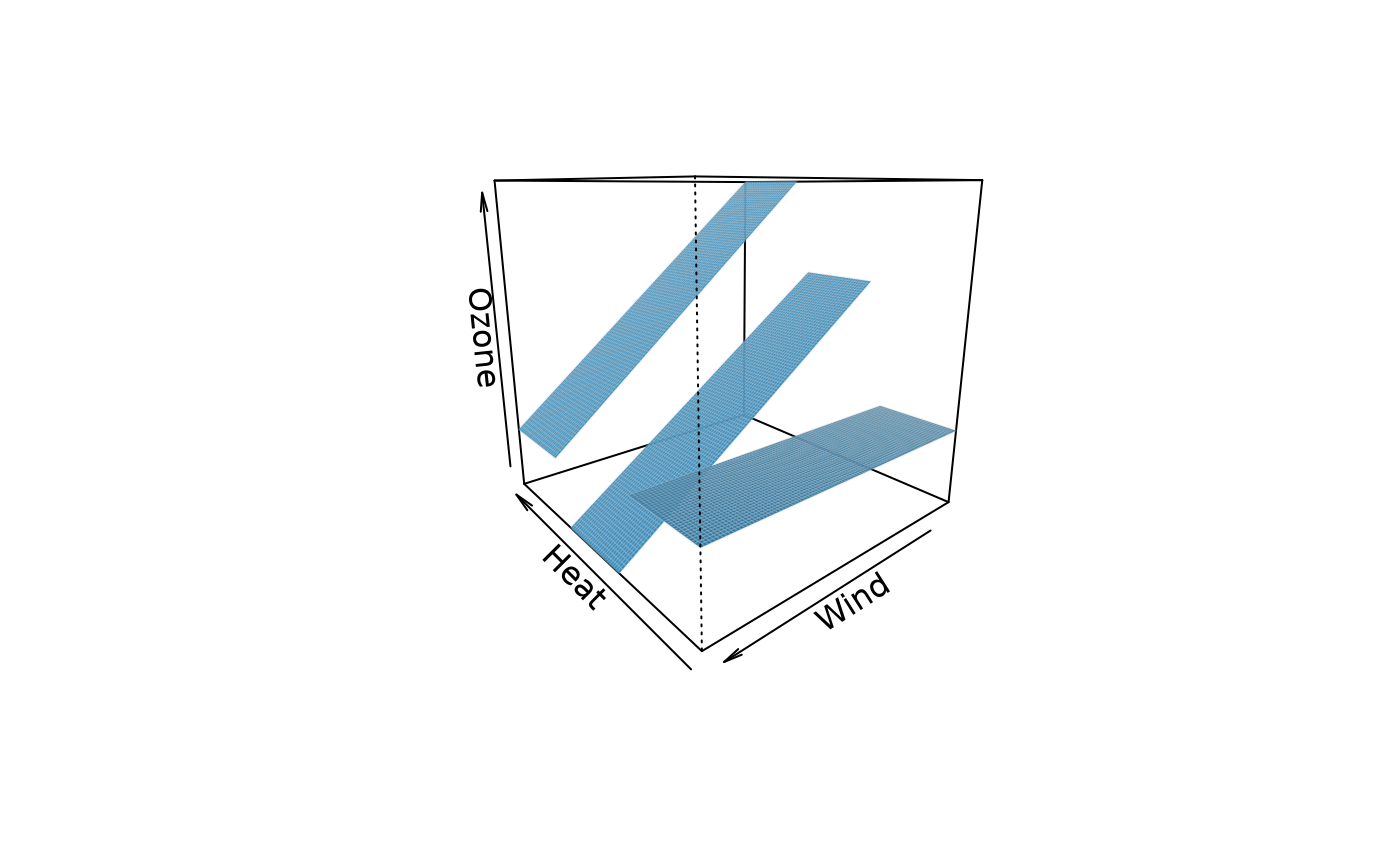
visreg2d(fit2, "Heat", "Wind", plot = FALSE) |> persp(theta = 230)
airquality$Heat <- cut(airquality$Temp, 3, labels = c("Cool", "Mild", "Hot"))
fit2 <- lm(Ozone ~ Solar.R + Wind * Heat, data = airquality)
visreg2d(fit2, "Heat", "Wind", plot = FALSE) |> persp(theta = 230)