Creates Plots of an lmm object
Examples
mel1 <- tumr(melanoma1, ID, Day, Volume, Treatment)
mel1_lmm <- lmm(mel1)
#> Warning: Model failed to converge with max|grad| = 0.3043 (tol = 0.002, component 1)
#> See ?lme4::convergence and ?lme4::troubleshooting.
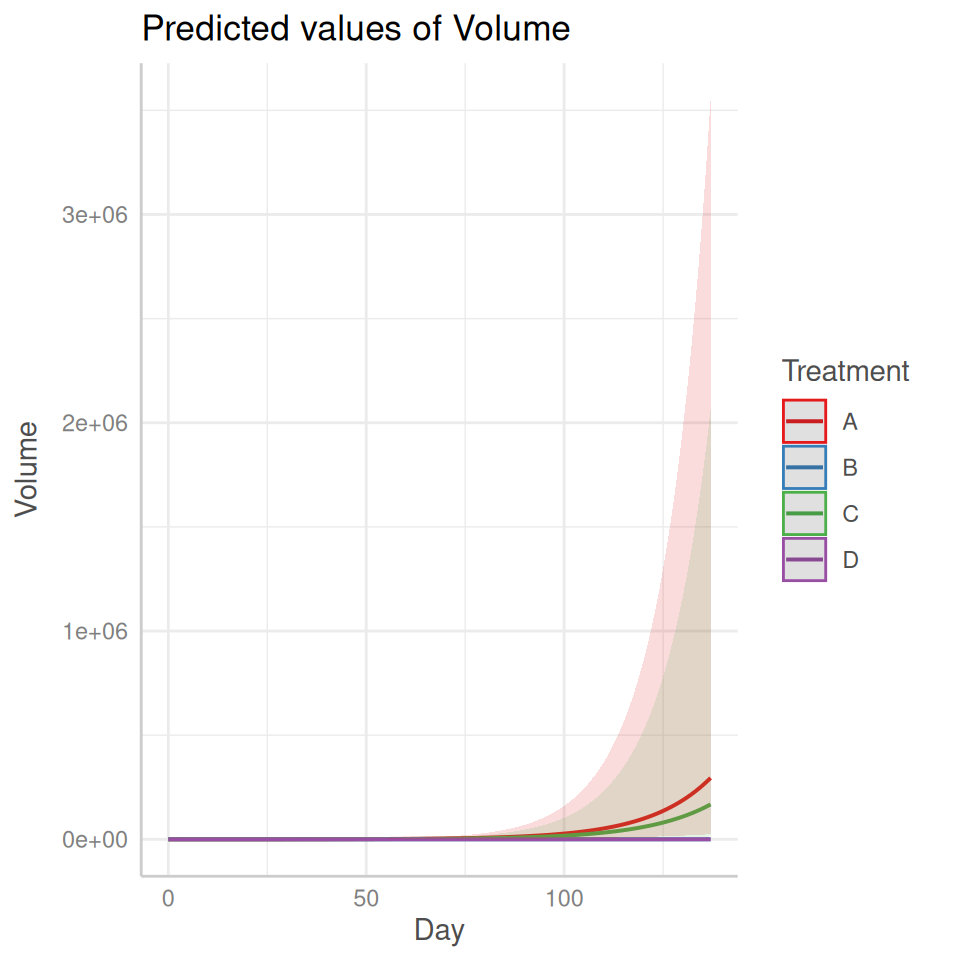
plot(mel1_lmm, "response")
#> Model has log1p-transformed response. Back-transforming predictions to
#> original response scale. Standard errors are still on the transformed
#> scale.
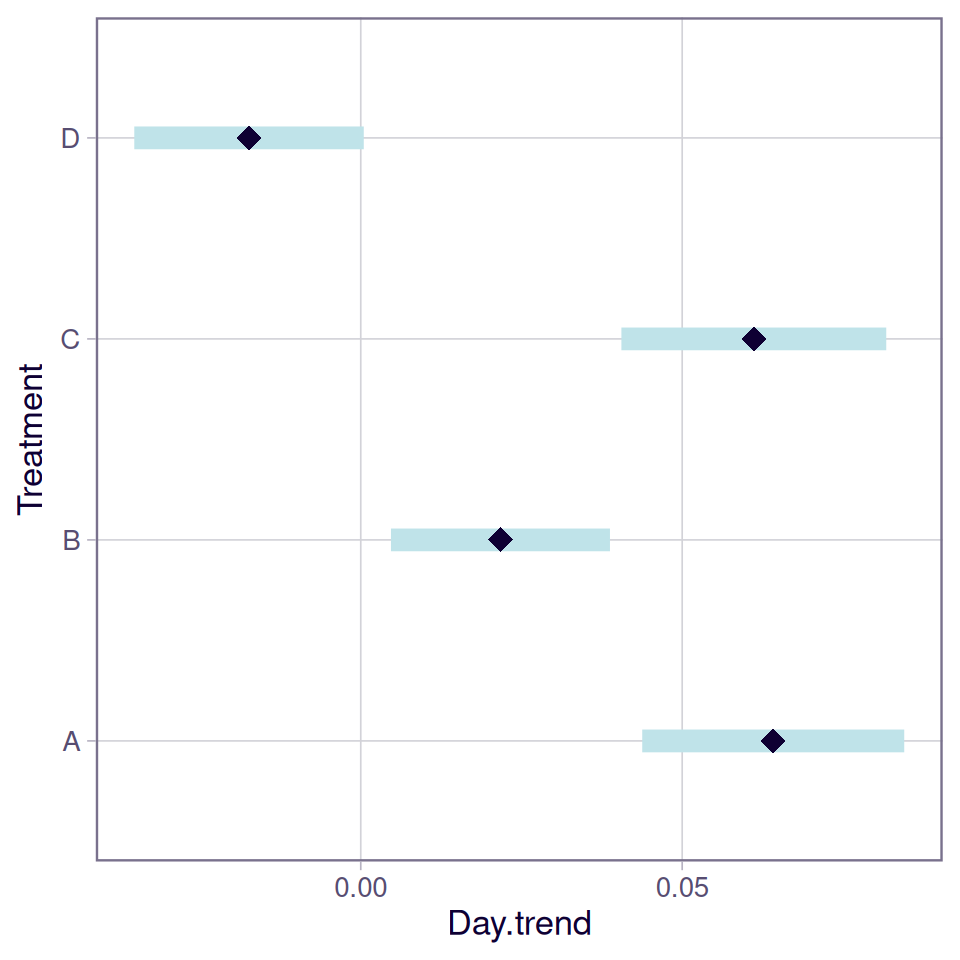
 plot(mel1_lmm, "slope")