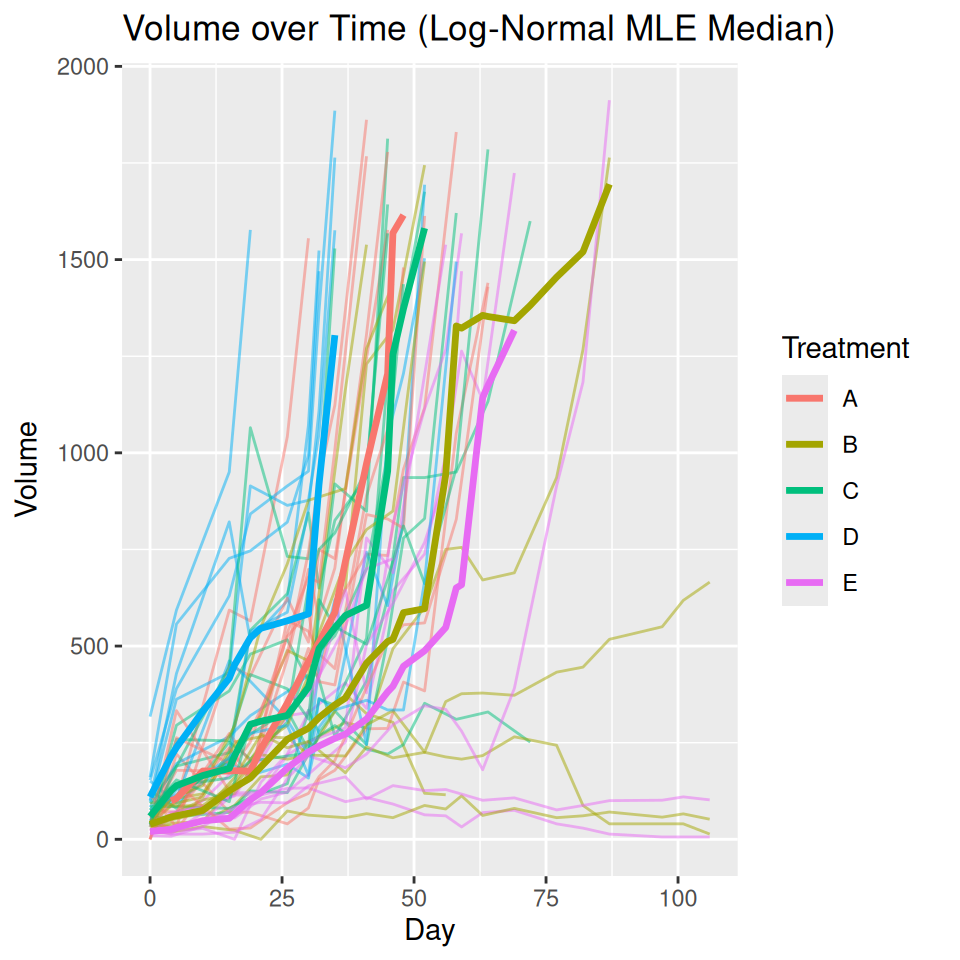
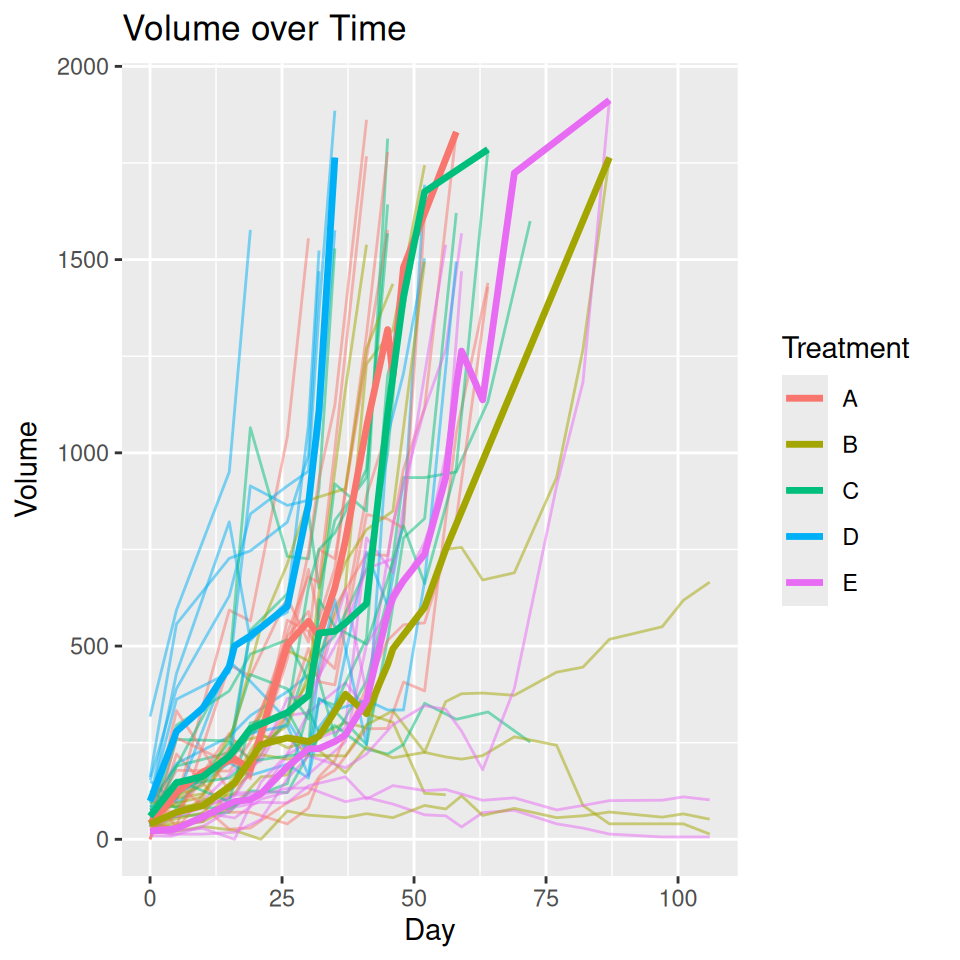
Plot of tumor growth over time using the median
Usage
plot_median(
  tumr_obj = NULL,
  data = NULL,
  group = NULL,
  time = NULL,
  measure = NULL,
  id = NULL,
  par = TRUE
)
Arguments
- tumr_obj
takes tumr_obj created by tumr()
- data
tumor growth data
- group
Column specifying the treatment group for each measurement
- time
Column of repeated time measurements
- measure
Column of repeated measurements of tumor
- id
Column of subject ID's
- par
Logical. If
TRUE, uses the parametric method. IfFALSE, uses the nonparametric method based on Kaplan-Meier estimation. Default isTRUE.