Plot method for cv_plmm class
Arguments
- x
An object of class
cv_plmm- log.l
Logical to indicate the plot should be returned on the natural log scale. Defaults to TRUE.
- type
Type of plot to return. Options include:
cve: cross-validation errorrsq: estimated fraction of the deviance explained by the model (\(R^2\))scale: estimated standard deviationsnr: estimated signal-to-noise ratioall: all of the above
- selected
Logical to indicate if the number of variables selected should be plotted on the top axis. Defaults to TRUE.
- vertical.line
Logical to indicate whether a vertical line should be plotted at the minimum/maximum value. Defaults to TRUE.
- col
Color for the points along the CV curve. Defaults to "red".
- ...
Additional arguments.
Value
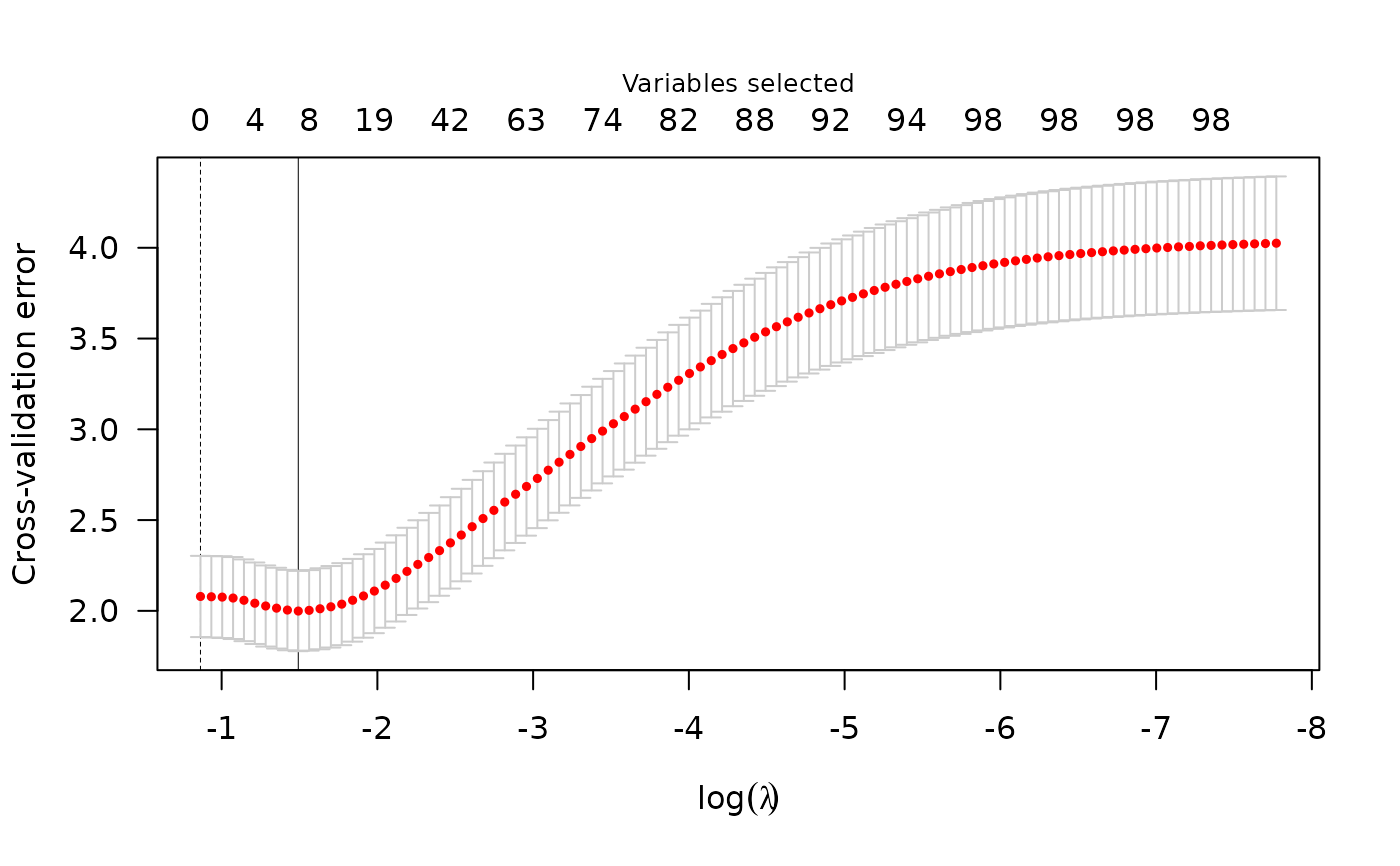
Nothing is returned; instead, a plot is drawn representing the relationship
between the tuning parameter lambda value (x-axis) and the cross validation error (y-axis).
Examples
admix_design <- create_design(X = admix$X, y = admix$y)
cvfit <- cv_plmm(design = admix_design)
plot(cvfit)