Plot method for plmm class
Usage
# S3 method for class 'plmm'
plot(x, alpha = 1, log.l = FALSE, shade = TRUE, col, ...)
Arguments
- x
An object of class
plmm- alpha
Tuning parameter for the Mnet estimator which controls the relative contributions from the MCP/SCAD penalty and the ridge, or L2 penalty.
alpha = 1is equivalent to MCP/SCAD penalty, whilealpha = 0would be equivalent to ridge regression. However,alpha = 0is not supported; alpha may be arbitrarily small, but not exactly 0.- log.l
Logical to indicate the plot should be returned on the natural log scale. Defaults to FALSE.
- shade
Logical to indicate whether a local nonconvex region should be shaded. Defaults to TRUE.
- col
Vector of colors for coefficient lines.
- ...
Additional arguments.
Value
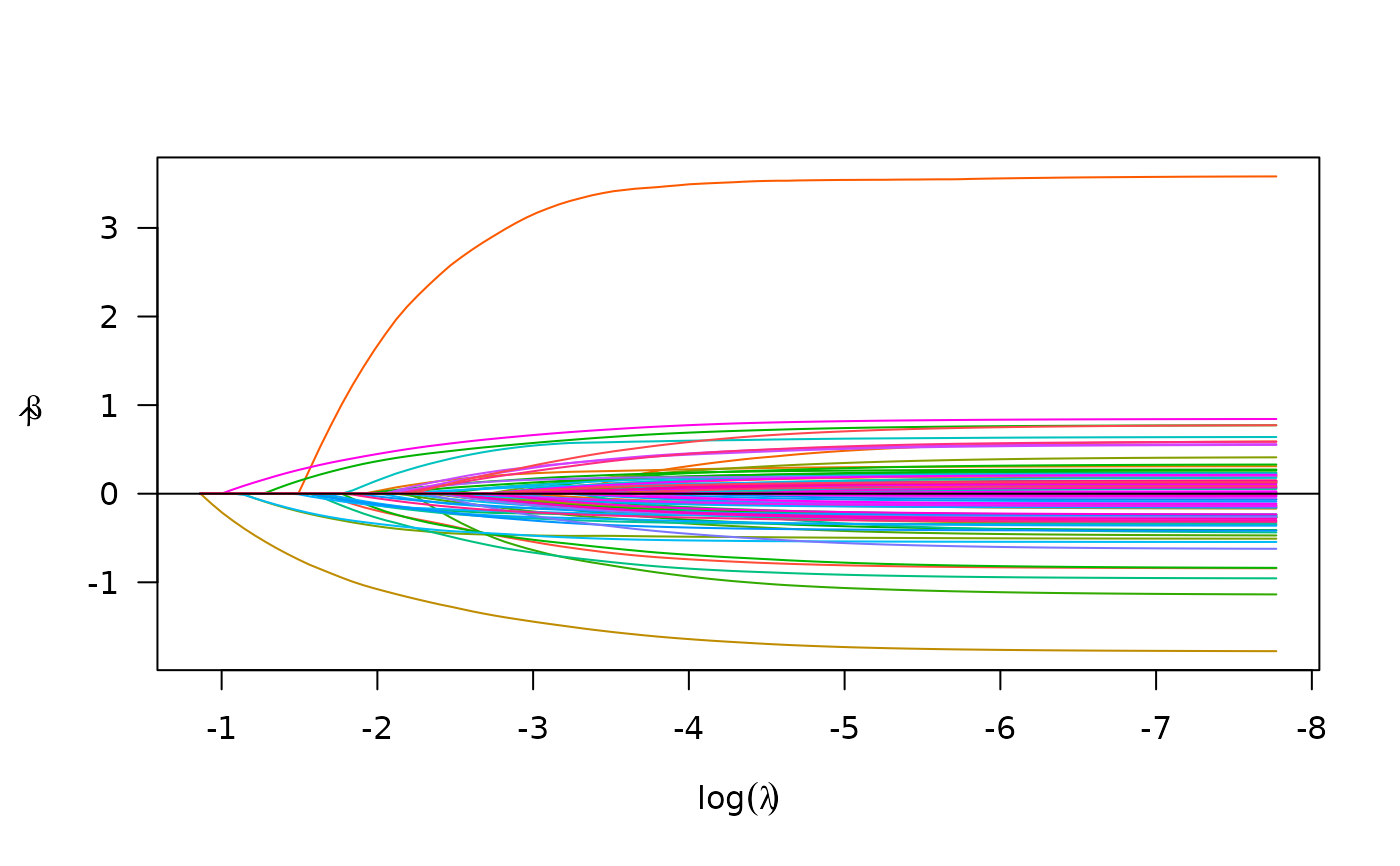
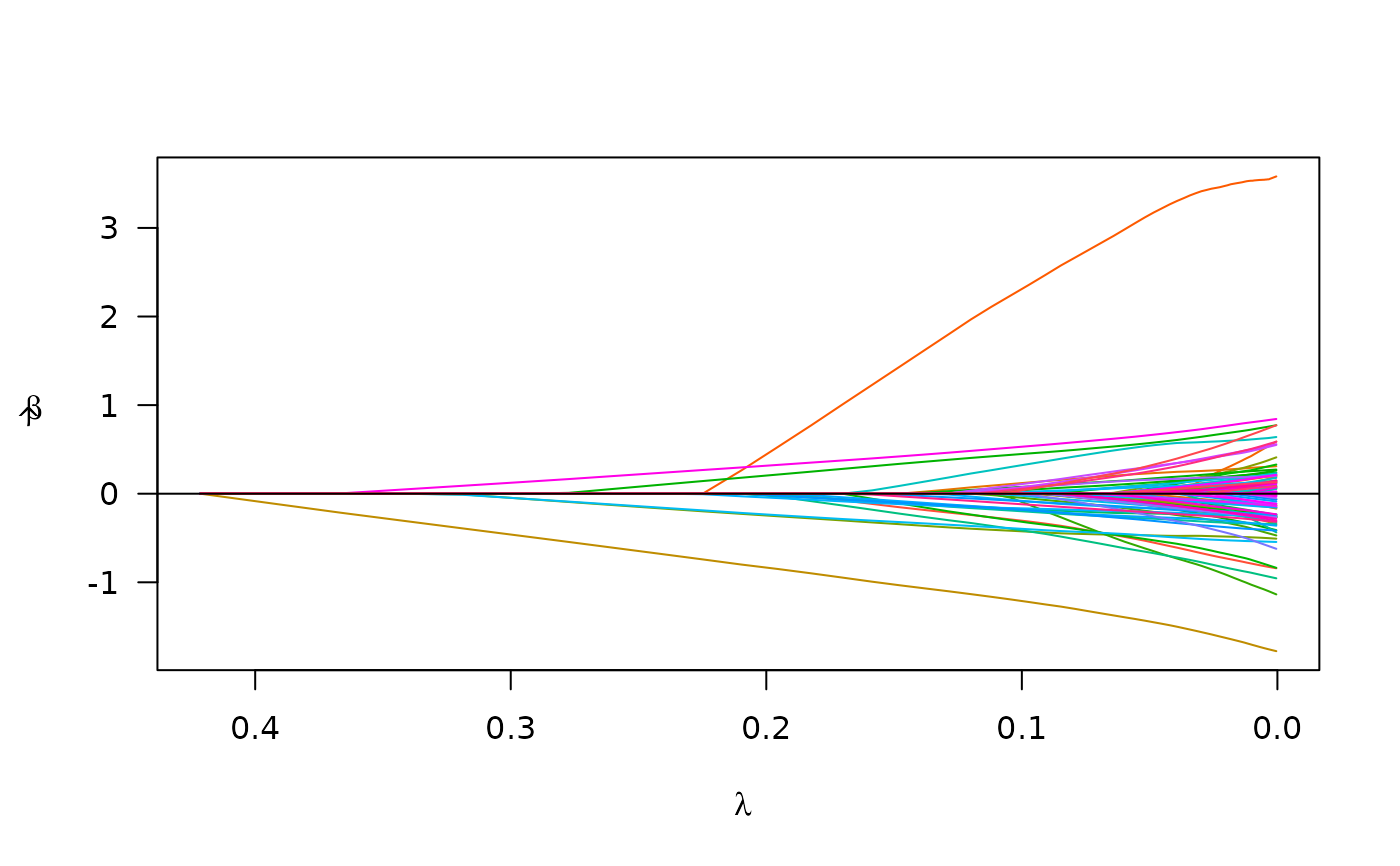
Nothing is returned; instead, a plot of the coefficient paths is drawn at each value of lambda (one 'path' for each coefficient).
Examples
admix_design <- create_design(X = admix$X, y = admix$y)
fit <- plmm(design = admix_design)
plot(fit)

plot(fit, log.l = TRUE)